liveBook · Manning

Distributional overlap

As explained in Causal Inference for Data Science

Distributional overlap is the sharing of values or ranges by the distributions of two groups.

Distributional overlap means that two groups share values within the ranges of their distributions. With propensity scores, overlap provides comparable treated and control patients at similar scores. section 5.3.3

Propensity-score distributions

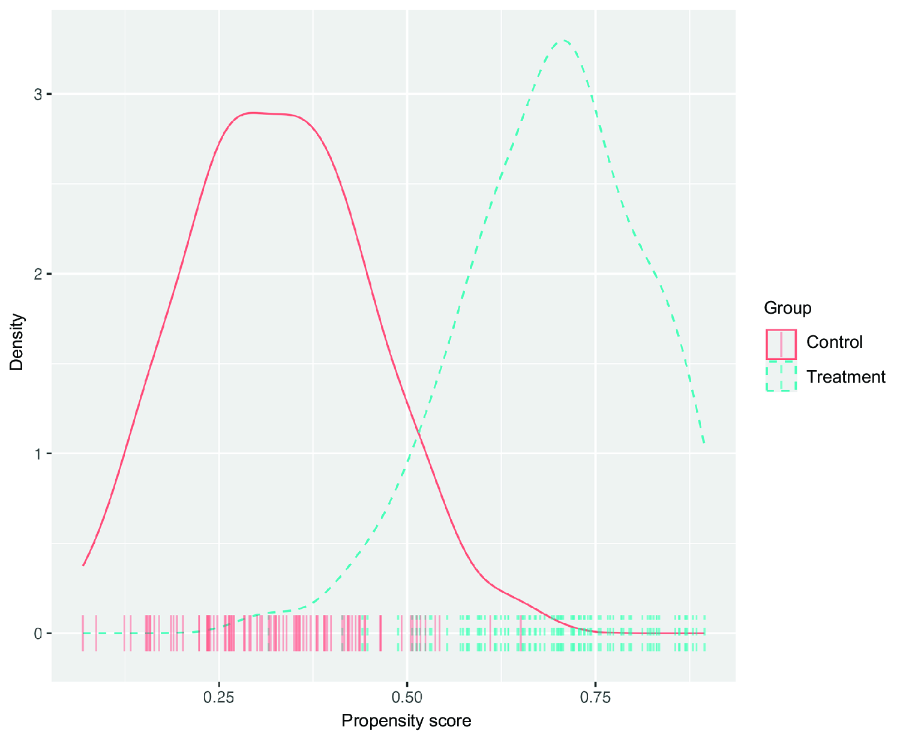
If treated patients have scores from 0.55 to 1 and controls from 0 to 0.5, the supports do not overlap, assignment is deterministic, and the positivity assumption fails. If both groups span roughly 0 to 1, overlap is full and ATE calculation can proceed. With overlap only from 0.25 to 0.75, restrict ATE analysis to that common-support region. section 5.3.3

Figure 5.11 Partial overlap in a distribution’s supports. We can calculate the ATE only for patients within the common support region.
figure

Use the partial-overlap figure to identify the common-support region and see why ATE estimation is limited to patients inside it. section 5.3.3

How Causal Inference for Data Science covers it

How deep it goes
Explains absent, full, and partial support overlap with propensity-score ranges and links each case to ATE feasibility.
Examples
Uses synthetic propensity-score distributions showing no overlap, full overlap, partial overlap, and treated-group overlap.
What it assumes
Assumes familiarity with treated and control groups, propensity scores, and causal estimands while defining distribution support directly.
What you can do after
Evaluate whether ATE estimation is supported and restrict analysis to patients within the common-support region.
How it connects
Connects propensity scores, positivity, common support, treatment assignment, ATE, ATT, and randomized controlled trials.

This explainer was generated by Manning's knowledge graph from the text of Causal Inference for Data Science. The section links point to the parts of the book it draws on.