A doji is a candlestick whose opening and closing prices are nearly equal, producing a small body and signaling market indecision. section 10.2.1
Read the doji with its wicks and neighboring candles: wicks show intraday price extremes, while multiple candles help reveal trends, reversals, or continuation patterns. section 10.2.1 section 10.4
Inspecting a doji on a candlestick chart
Load price data into a pandas DataFrame and plot it with mplfinance using a candle chart. Inspect candles with nearly equal opening and closing prices, then compare their wicks and surrounding days. section 10.2.1
Figure 10.20 Various candlestick patterns in which we can describe the behavior of the market. In addition to the Doji, Hammer, and Engulfing patterns, we can see the volatility of prices. You immediately realize that candles with long bodies represent high volatility, whereas candles with multiple short bodies represent a calm market situation.
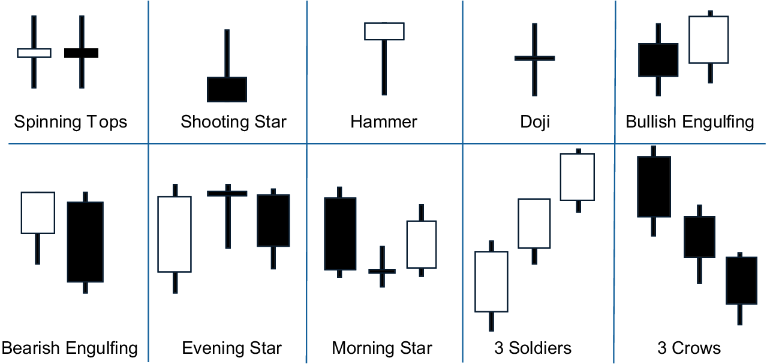
Compare the doji with hammer and engulfing patterns, and relate body size to observed market volatility. section 10.2.1
