DORA metrics act as a delivery system’s report card: deployment frequency and lead time track delivery speed, while change failure rate and time to restore service track stability. Together, they show how well an architecture supports both. section 13.8
Read each measure as both a delivery signal and a clue about architectural friction:
- Deployment frequency tracks how often code safely reaches production; tightly coupled systems may ship quarterly, while decoupled services can ship multiple times a day. section 13.8
- Lead time for changes measures the journey from commit to production; manual provisioning can stretch it to weeks, while containerized pipelines can shrink it to minutes. section 13.8
- Change failure rate tracks deployments that degrade production and require intervention; a high rate points to weak testability and the value of automated commit gates. section 13.8
- Time to restore service tracks recovery from production anomalies; hidden dependencies can turn troubleshooting into hours of work. section 13.8
Figure 13.12 The Dual Axes of DORA Metrics. High-velocity development metrics (Deployment Frequency and Lead Time) are continuously counterbalanced by operational stability metrics (Change Failure Rate and Time to Restore Service).
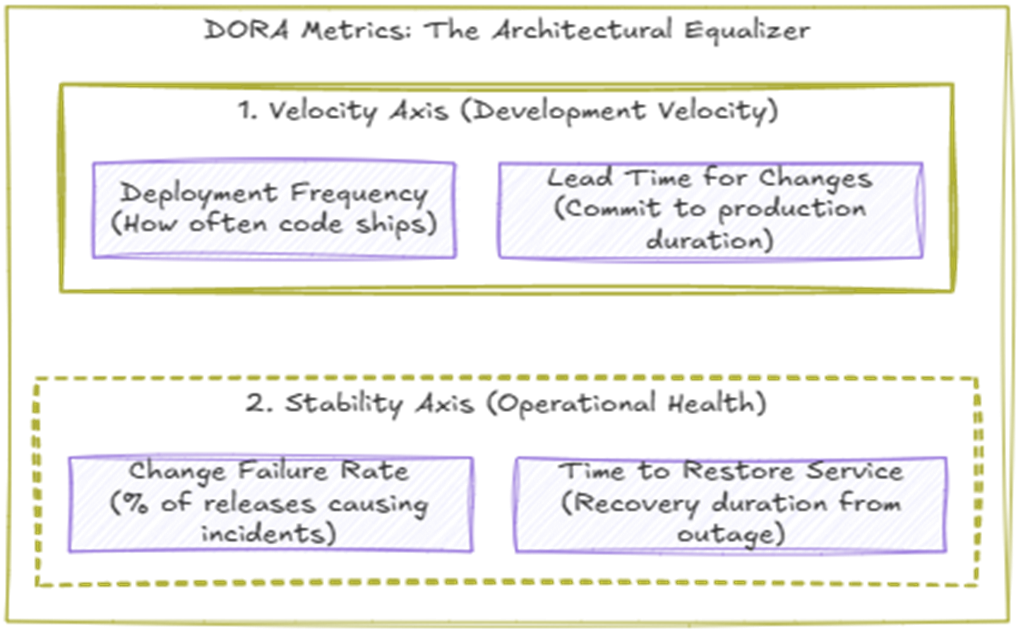
The figure groups deployment frequency and lead time as velocity measures, balanced by failure rate and recovery time as stability measures. section 13.8
Use the four measures together: they provide feedback on whether service boundaries are helping the system deliver quickly without sacrificing production stability. section 13.12 section 13.8