Electricity consumption is the amount of electrical energy a home uses. In a home digital twin, measuring it serves a decision: when should appliances or heating and cooling run to reduce electricity costs? Consumption is not the same as a bill, which is a cost measure, or a grid import, which depends partly on how much solar electricity the home uses as it is generated. section 2.2 section 8.3.2
Table 2.3 Objectives, opportunities, and required data for a home digital twin
|
Opportunity
|
Annual cost
|
Current decision
|
Better decision
|
Key data needed
|
|---|---|---|---|---|
|
Use solar PV electricity more effectively.
|
$2,160
|
Run appliances when convenient.
|
Schedule high-power loads during optimal solar production.
|
Real-time electricity usage, solar PV output, appliance scheduling
|
|
Reduce excessive water
use from over-irrigation.
|
$456
|
Water based on a fixed schedule.
|
Irrigate based on soil moisture and weather forecast.
|
Soil moisture sensors, rainfall forecast, and irrigation flow rates
|
|
Make more efficient cooling/heating decisions.
|
$1,800
|
Adjust temperature for immediate comfort.
|
Optimize timing with solar production and occupancy.
|
Indoor/outdoor temperature, occupancy detection, HVAC energy usage
|
|
Mitigate risk of fire and flood.
|
$50,000 potential
|
Use only smoke detectors.
|
Use leak detection.
|
Moisture and water flow measurements
|
The opportunity table links electricity-use decisions to the data they require. Scheduling high-power loads calls for real-time usage, solar output, and appliance scheduling; heating and cooling decisions also need occupancy and temperature data. section 2.2
Start with a baseline, then keep the digital representation in sync with the home. Where smart-home infrastructure is absent, historical records can establish the baseline while new measurements improve it. An electricity bill provides a lagging success metric; a daily usage dashboard and alerts provide more frequent feedback. section 2.2.1 section 2.2
Table 3.3 Sensors I chose to capture the physical environment for representation in my home digital twin
|
Measurement
|
Location
|
Sensor model
|
Power
|
Update rate
|
|---|---|---|---|---|
|
Electricity use (total)
|
Meter box
|
PowerPal Smart Meter Monitor
|
Battery
|
1 min
|
|
Electricity use (appliances)
|
Power outlets
|
Netvox R809A & Milesight CT101
|
Power outlets
|
30 mins
|
|
Total water use
|
Meter
|
Dragino AIS01-LB
|
Battery
|
Daily
|
|
Garden water use
|
Garden taps
|
Dragino SW3L
|
Battery
|
5 mins
|
|
Laundry water use
|
Laundry
|
YF-S201 + ESP32
|
Power outlets
|
5 mins
|
|
Rainwater storage
|
Rainwater tank
|
Dragino DDS20
|
Battery
|
Daily
|
|
Indoor temperature and humidity
|
Indoor rooms
|
Dragino LHT52
|
Battery
|
30 mins
|
|
Indoor environment
|
Living area
|
Milesight AM319
|
Power outlets
|
10 mins
|
|
Outdoor temperature and humidity
|
Outdoors
|
Dragino LHT65S
|
Battery
|
30 mins
|
|
Indoor occupancy level
|
Living area
|
Coral board with edge TPU
|
Power outlets
|
Continuous
|
|
Swimming pool chemistry
|
Swimming pool
|
Manual pH meter
|
Battery
|
Daily
|
The sensor plan separates total electricity use at the meter box from appliance use at power outlets. It also records occupancy, temperature, and humidity—conditions that help explain or guide power-use decisions. The listed update rates differ, so these measurements do not arrive at one uniform frequency. section 3.2.4
From measurement to a decision
A peak monthly electricity bill of $330 gives a baseline for a $300 target over 12 months. For a day-to-day decision, compare usage with solar output and shift a high-power appliance toward solar production when scheduling permits. The bill tests the longer-term result; the usage and generation data support the immediate choice. section 2.2
Figure 8.9 A visualization of daily electricity sold (exported), bought (imported), and generated, alongside environmental conditions, from July to December 2025 for my home
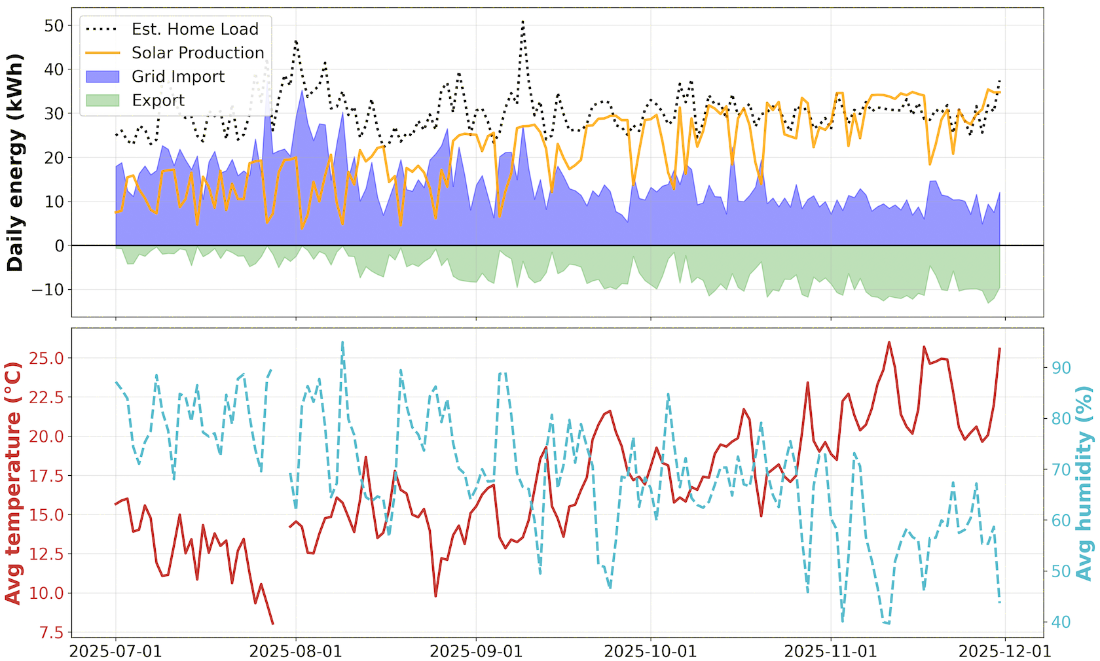
The daily plot places electricity used, grid imports, grid exports, and environmental conditions together. Viewing these series side by side helps distinguish household demand from electricity purchased or sold. section 8.3.2
Forecasting adds a further decision aid. Home power use can spike when an appliance starts, making it less smooth than temperature. An AutoGluon time-series workflow can predict grid imports from forecast environmental conditions; those predictions can inform behavior that reduces imports or help assess a storage-battery case. section 8.3.2




