An engulfing pattern is a candlestick formation in which a large candle completely contains the preceding candle, indicating a substantial shift in momentum. section 10.2.1
Read the pattern alongside candlestick anatomy:
- Compare consecutive candles rather than interpreting one trading day in isolation. section 10.2.1
- Use body size and wick behavior as context: large bodies indicate strong momentum, while long wicks indicate price-level rejection. section 10.2.1
- Treat the engulfing label as a way to describe a substantial momentum shift, not as a complete market analysis. section 10.4
Chart inspection
Plot daily OHLC data as candles, then inspect adjacent candles for a large candle that fully contains the prior one. Compare the result with other named patterns such as Doji and Hammer. section 10.2.1
Figure 10.20 Various candlestick patterns in which we can describe the behavior of the market. In addition to the Doji, Hammer, and Engulfing patterns, we can see the volatility of prices. You immediately realize that candles with long bodies represent high volatility, whereas candles with multiple short bodies represent a calm market situation.
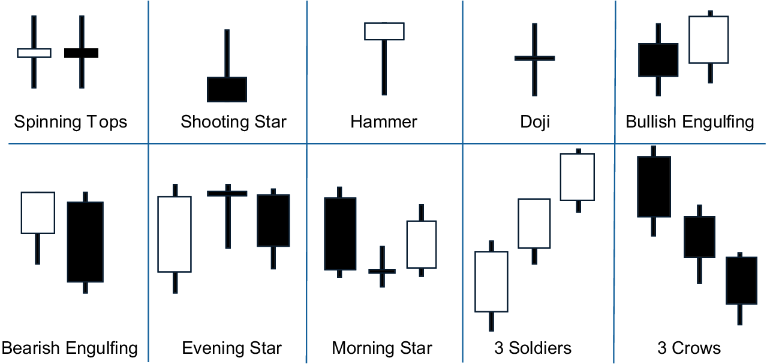
Use the pattern diagram to compare engulfing candles with Doji, Hammer, body size, and market volatility. section 10.2.1
