liveBook · Manning

Error rate

As explained in Machine Learning Algorithms in Depth

The proportion of examples whose predicted class differs from the true class.

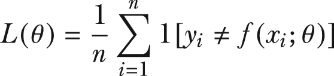
Error rate, also called average misclassification rate, measures the proportion of n labeled examples for which the predicted class differs from the true class: (1/n) Σᵢ 1[f(xᵢ; θ) ≠ yᵢ]. The indicator contributes 1 for an incorrect prediction and 0 otherwise. section 1.1

As a classification loss, error rate is minimized by choosing parameters θ that make the proportion of incorrect predictions approach zero. Evaluation should include unseen test examples, not only labeled training data, to assess generalization. section 1.1

(1.1)
figure

Equation (1.1) provides the formal error-rate definition and its indicator-function construction. section 1.1


How Machine Learning Algorithms in Depth covers it

How deep it goes
Defines the indicator-based average and optimization goal, but does not derive an implementation or compare class-specific metrics.
Examples
Uses equation 1.1 and an indicator function to represent incorrect predictions across labeled examples.
What it assumes
Assumes labeled examples, predicted classes, true labels, and learnable parameters; defines the indicator function directly.
What you can do after
Evaluate classification predictions by computing the fraction of examples whose predicted and true labels disagree.
How it connects
Connects classification loss with cross-entropy, mean squared error, training data, test data, and generalization.

Also explained in

Compare how 6 books explain error rate →

Related concepts

This explainer was generated by Manning's knowledge graph from the text of Machine Learning Algorithms in Depth. The section links point to the parts of the book it draws on.



