Expected value analysis compares uncertain choices by multiplying each possible outcome by its probability, then summing the products. In NBA drafting, it estimates the career win shares associated with different draft positions. section 20.6
A practical analysis follows these steps:
- Classify players into career-outcome bands using win shares: superstar, star, starter, reserve, or marginal. section 20.6
- Calculate each outcome's probability within a draft segment by filtering the data, counting matching players with tally(), and dividing by the segment size. section 3.8
- Calculate each outcome's median win shares with summarize() and median(). section 3.8
- Multiply the probability and median vectors element by element, then use sum() to obtain the expected value. section 3.8
Top-five versus later first-round picks
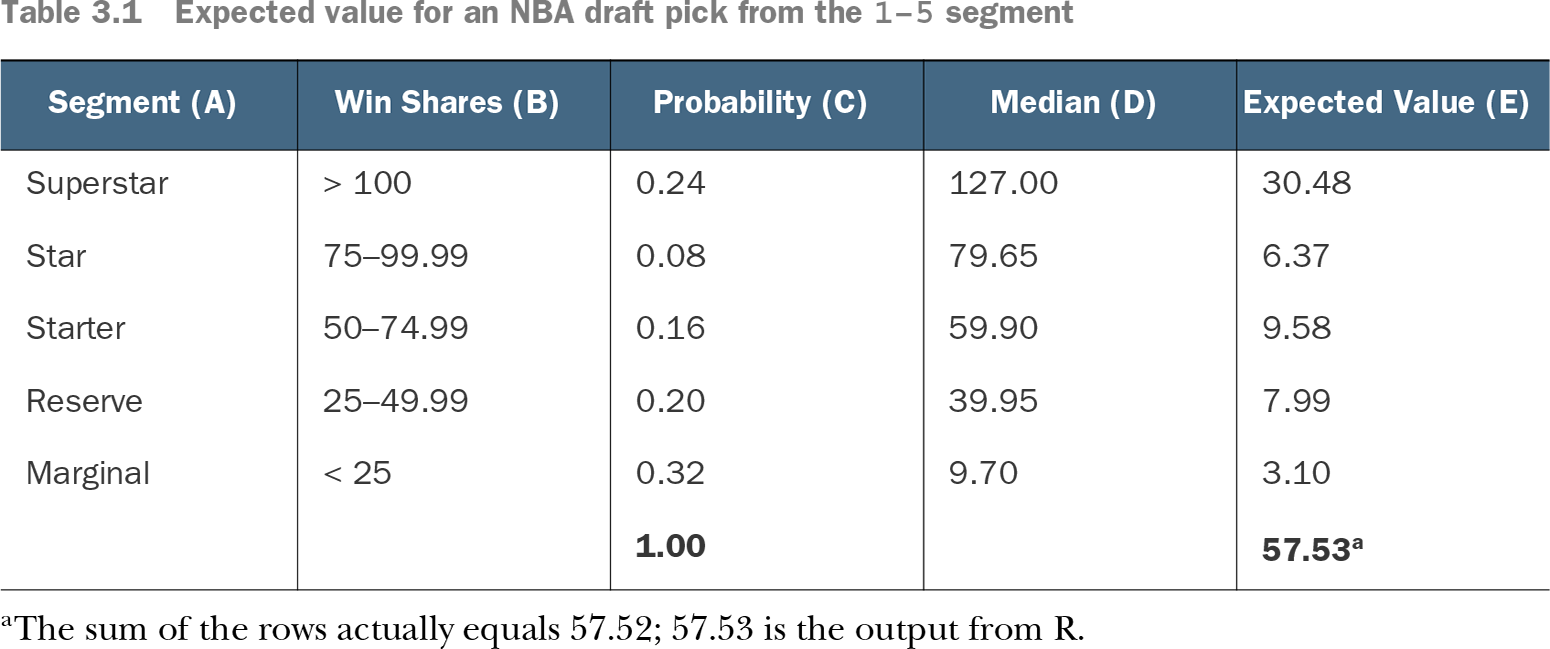
For 2000–2009 NBA drafts, a top-five pick had a 24% probability of becoming a future superstar, compared with 1% for another first-round pick. Weighting all five outcomes by their median win shares produced expected values of 57.53 and 21.21 career win shares, respectively. section 20.6
Table 3.1 Expected value for an NBA draft pick from the 1-5 segment (view table figure)
| 57.531 |
Use the outcome table to inspect how probabilities, median win shares, and probability-weighted contributions combine into the top-five estimate. section 3.8