A model’s expressive power, or capacity, is the range and complexity of functions it can represent. Increasing depth can expand that capacity, but before ResNet it often made optimization harder and training error higher. section 3.0 section 3.2
Residual connections helped resolve this tension by preserving the forward signal and gradient pathways, making much deeper networks practical. ResNet-152 was eight times deeper than VGGNet-19 yet required fewer computational operations. section 3.0
Capacity also shapes generalization. The classical picture predicts falling training error and U-shaped test error as capacity grows. In modern overparameterized models, test error can rise near the interpolation threshold, then fall again; regularizers and optimizer biases can favor simpler solutions beyond it. section 8.5.2 section 8.5.3
Figure 8.9 Left: the classical bias–variance tradeoff. Training error (called “risk” in this image) is shown as a dashed line. It falls monotonically, whereas the test error (solid line) is U-shaped, with the bottom being optimal. Right: beyond the interpolation threshold, test error peaks and then declines again in the overparameterized (interpolating) regime, while training risk remains near zero. Used with permission granted by the lead author (Mikhail Belkin).
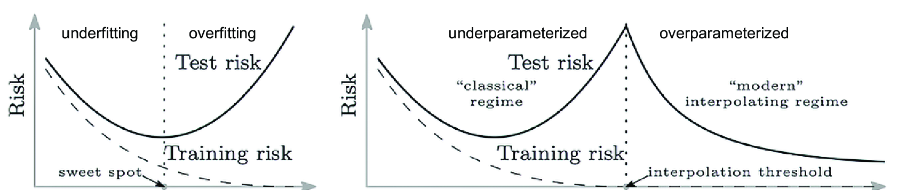
Compare the classical U-shaped test-error curve with its renewed decline beyond the interpolation threshold. section 8.5.2
Figure 8.10 Test (solid line) and training (dashed line) errors for ResNet as the width increases. A peak near the interpolation threshold (dashed line; shaded “critical” band) illustrates double descent, in which error rises as the model fits the data, then falls again for larger widths. Used with permission granted by the lead author (Preetum Nakkiran).
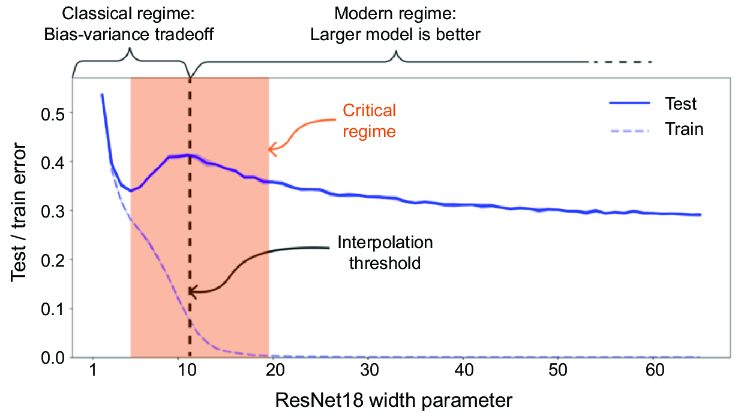
See how test error peaks near the interpolation threshold and falls as ResNet width increases. section 8.5.3









