Feature scaling transforms numeric columns so their values have comparable ranges or dispersions. It matters when an outlier detector measures distances between rows: without scaling, a feature with large numbers can overwhelm smaller-valued features, regardless of their relevance. section 3.2 section 4.10
Why scale baseball statistics?
Suppose Games played ranges from 1 to 3,562, while Triples ranges from 1 to 309. An unscaled Euclidean distance between players would largely reflect Games played. Scaling makes both features count in the calculation; it does not change either feature’s distribution. section 4.10
Figure 4.8 Data before (left) and after (right) scaling. Robust scaling was used in this example. The distributions are identical, but the scales are adjusted.
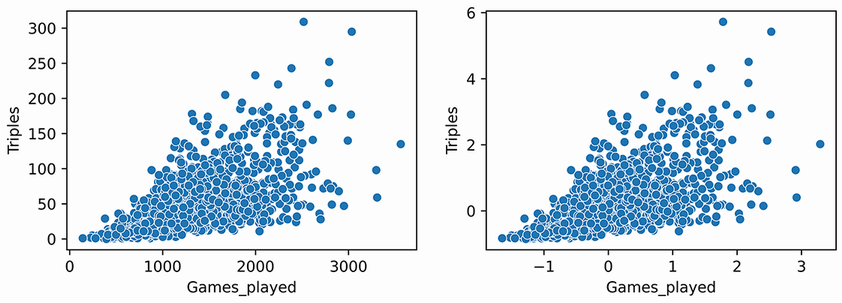
The before-and-after plots show the same points after robust scaling adjusts their feature scales. section 4.10
Common choices differ in what they use as a reference:
- Min-max scaling puts values between 0 and 1. section 4.10
- Standard scaling expresses each value as its number of standard deviations from the feature mean—a z-score. section 4.10
- Robust scaling uses the median and interquartile range rather than the mean and standard deviation. Extreme values therefore have less influence on its reference points. section 9.5
Scale after converting categorical features to numeric values when a detector requires numeric input. Distance-, density-, and clustering-based detectors generally need comparable scales, including for encoded categories; some other detectors, such as Isolation Forest and HBOS, do not require scaling. Within one detector’s input, use the same scaling method for every feature. section 4.10 section 9.5
A concise robust-scaling step
For a numeric pandas DataFrame, use `scaler = RobustScaler()` followed by `df = pd.DataFrame(scaler.fit_transform(df), columns=df.columns)`. This retains the column names while replacing their values with scaled ones. section 4.10
The choice is consequential, not automatic. In a nearest-neighbor example, adding one extreme row changed the neighbors returned after min-max scaling, while those returned after robust scaling stayed the same. Different detectors can also favor different scaling methods. With little labeled outlier data, synthetic data or doping can help assess the choice, but neither makes one method universally best. section 9.5
Scaling also applies to detector outputs. Scores from different detectors may have radically different ranges, so an ensemble usually scales each detector’s scores before combining them. This is a separate step from scaling input features. Scores from identical detector types trained on different samples or feature sets can sometimes remain unscaled; scaling them may discard information. section 14.5 section 14.1




