Fluent Bit is a lightweight, event-driven telemetry agent that captures, processes, and distributes logs, metrics, and traces. It gathers transient observability data from many sources and forwards it to secure storage, aggregation, or analysis systems, helping teams preserve evidence and reduce the time from incident to diagnosis. section 1.1 section 1.1.1
Events are carried as metadata, a timestamp, and a record. Metadata includes a Tag: a logical event name used to route events to operations. The record holds log, metric, or trace data; logs may be plain text or key-value data, and parsing can extract fields or convert payloads to JSON. section 1.2.1 section 1.3.5
Figure 1.2 Logical Fluent Bit architecture, with the blocks representing logical features and the lines representing the possible flow of events. The standard Fluent Bit groupings are overlaid, but I’ve separated and illustrated the buffers slightly differently, as their positions are more logical than how they fit into the code base.
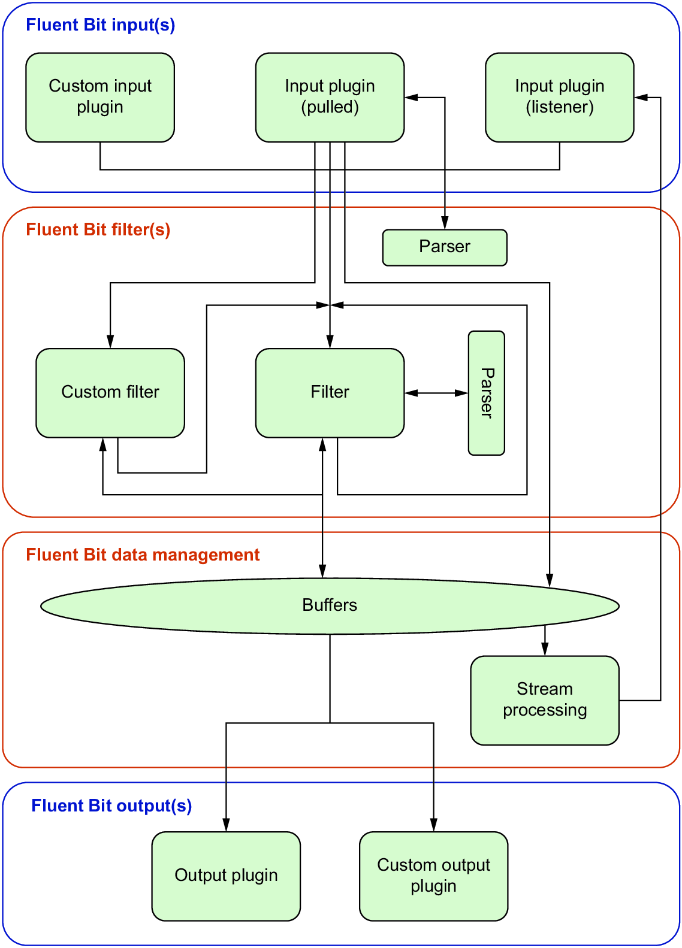
Follow the pipeline from inputs through parsing, buffering, filtering, and routing to outputs. Input design matters operationally: listeners can experience backpressure during spikes, while file-oriented inputs poll for new content. section 1.2.2
A Fluent Bit pipeline is assembled from plugins and operational controls:
- Inputs receive events either as network listeners or by polling sources such as files. Input implementation affects configuration, tuning, and throughput. section 1.2.2
- Parsers turn received content into useful fields or JSON; filters can discard insignificant events or direct matching events to one or more outputs. section 1.2.2 section 1.3.5
- Buffers batch events for more efficient transfer and absorb variation between receiving and downstream processing. section 1.2.2 section 1.3.5
- Plugins provide the functional building blocks and can be extended for inputs, outputs, and filters with C, Go, WebAssembly, or Lua-based filter logic. section 1.2 section 1.3.3
Its compact native-binary design favors fast startup and efficient CPU and memory use in IoT, containers, and Kubernetes. Thread controls can isolate inputs and outputs and raise throughput, but extra threads need care where container CPU allocation is uncertain. section 1.3.1 section 1.4
Fluent Bit works alongside OpenTelemetry rather than replacing it: it can facilitate transmission of OTel logs, metrics, and traces to compliant aggregation or processing points. It also interoperates with Fluentd, enabling blended deployments and gradual transitions. section 1.3.2 section 1.3.5
Validate and inspect a local deployment
Use `fluent-bit -V` to confirm the installed version. Run `fluent-bit -l fb.log`, stop it after about 10 seconds, and inspect `fb.log` for startup information. Use `fluent-bit -i dummy -h` to view help for the dummy input plugin; `--dry-run` validates a configuration without running its pipelines. section 2.1.2


