How close must a demand forecast be before it is useful for supply-chain decisions? Forecast accuracy measures the spread between forecast values and actual demand: it indicates the magnitude of error, not whether forecasts are consistently too high or too low. Higher accuracy is generally better, but accuracy alone does not make a forecast useful. A forecast can be accurate at the wrong granularity, built from unsuitable demand data, or aimed at an irrelevant planning horizon. section 8.1 section 1.3
Assess accuracy together with bias. Bias captures the average direction of error—whether forecasts overshoot or undershoot demand—while accuracy captures error size. The two can conflict: an accurate but biased forecast can create lost sales and a poor production signal, whereas an inaccurate but unbiased forecast can create supply-chain variation. Choose according to the consequences, rather than assuming one KPI identifies the best forecast. section 8.1
Use accuracy as a disciplined improvement measure rather than a universal score:
- Define the decision first: forecast demand at the aggregation and horizon at which inventory, production, or deployment decisions are made. section 14.4.1
- Measure historical errors over corresponding forecast and demand periods; analyze relevant forecast lags rather than relying on a single convenient view. section 8.2.2
- Select KPIs for their consequences. MAE, MAPE, and RMSE expose different strengths and pitfalls; MAE plus bias is presented as a strong practical compromise, while MAPE should be avoided. section 8.7 section 9.5
- Compare results with a simple benchmark, such as a moving average, instead of judging an error percentage against a prior year, arbitrary target, or industry benchmark. section 10.1 section 10.3
- Weight portfolio-level measures by value when products differ in importance, so low-value and critical products are not treated as equivalent. section 11.0
A 36.1% error is not a verdict
A statistical forecast for a pharmaceutical manufacturer has historical MAE of 36.1% and bias of 1.6%. Those figures cannot, by themselves, establish whether the forecast is good enough: demand may be inherently complex or random. Compare the result with a benchmark on the same series before judging model quality. section 10.0 section 10.1
Accuracy also evaluates the forecasting process, not only the model. Compare a baseline forecast, planner adjustments, sales inputs, and the final consensus forecast to see whether each stage improves accuracy enough to justify its workload. Use the findings to improve collaboration and process design, not to reward, punish, or embarrass participants; rigid targets can encourage metric gaming instead of business value. section 12.2 section 12.2.3
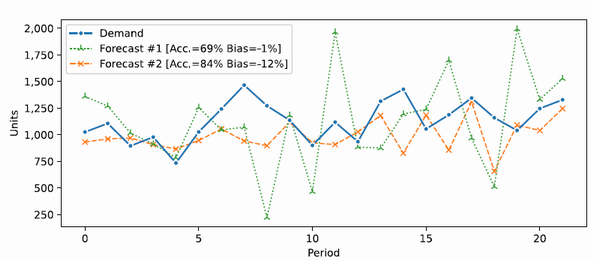
Compare an accurate but biased forecast with an inaccurate but unbiased one to inspect why accuracy and bias require separate measures. section 8.1
