Forecast Value Added (FVA) evaluates whether every handoff in a forecasting process improves on the preceding forecast. Start with a baseline forecast, then measure the accuracy and bias of each successive version produced by planners, sales teams, or a consensus meeting. A positive FVA means a step added accuracy; a negative result means it made the forecast worse. section 12.2.1 section 12.0
The practical question is not merely whether the final forecast is accurate, but whether each contributor earns the effort spent changing it. FVA therefore serves two goals: efficacy, by testing whether adjustments improve predictions, and efficiency, by weighing their marginal improvement against the time required. section 12.2 section 12.2.2
Run an FVA analysis as a repeatable process:
- Preserve a forecast version for the benchmark or baseline and for every team or review step. section 12.2.4
- Calculate forecast accuracy and bias at each step, then compare each result with the immediately preceding step. section 12.2.1
- Record rough person-hours for each manual step so accuracy gains can be assessed against effort. section 12.2.2
- Break results out by product group, channel, or region when teams, information, or buying behavior differ. section 12.2.3
- Investigate persistent negative FVA for root causes such as bias or misaligned incentives before removing a step. section 12.2.3
Reading an FVA dashboard
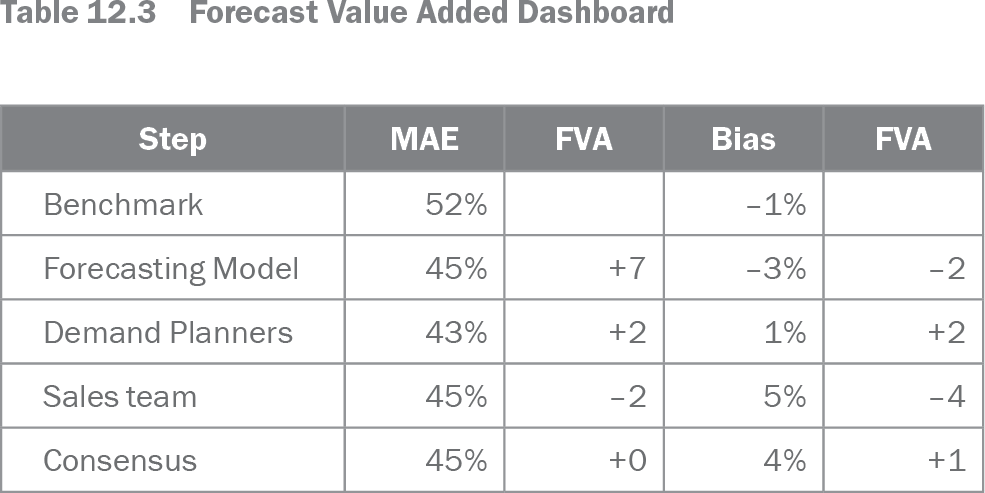
A benchmark has MAE of 52%. The forecasting model reduces it to 45%, adding 7 points of accuracy. Demand planners improve it again to 43%, adding 2 points. Sales then raise MAE back to 45%, producing FVA of −2, while increasing bias from 1% to 5%. The consensus step leaves MAE unchanged at 45%, so it adds no accuracy despite consuming meeting effort. This isolates where review is helping and where it is not. section 12.2.1 section 12.2.2
Use FVA to improve a process rather than punish isolated bad outcomes. Small adjustments may fall within the error margin and consume disproportionate time; larger, well-explained adjustments are more likely to matter. Track FVA across relevant forecasting horizons and pair it with value-weighted KPIs to concentrate attention on commercially important items. section 12.2.3
Getting started can be as simple as comparing the consensus forecast with an internal moving-average benchmark. Scaling to every step, lag, and horizon requires retained forecast versions and automation; a six-month horizon with a baseline, benchmark, and three reviewing teams requires 30 versions. section 12.2.4
Table 12.3 Forecast Value Added Dashboard (view table figure)
| Step |
MAE |
FVA |
Bias |
FVA |
|---|---|---|---|---|
| Benchmark |
52% |
–1% |
||
| Forecasting Model |
45% |
+7 |
–3% |
–2 |
| Demand Planners |
43% |
+2 |
1% |
+2 |
| Sales team |
45% |
–2 |
5% |
–4 |
| Consensus |
45% |
+0 |
4% |
+1 |
Inspect the dashboard to see how MAE, bias, and FVA change from the benchmark through model, planners, sales, and consensus. section 12.2.1