Forecasting quality is the degree to which forecasts meet the performance needed for a planning decision. It cannot be reduced to a single error percentage: assess both accuracy and bias, and judge results against the demand pattern, forecast granularity, and business context. A country-level monthly forecast can be far easier to predict than daily sales of one product at one store. section 1.2.3 section 10.0
Start by defining what success means, then select metrics that represent it. Tracking bias and MAE offers a practical balance of business value and complexity; value-weighted metrics become important when products vary widely in price. Use simple KPIs to communicate process performance across teams, while retaining more elaborate measures for model evaluation. A metric that is not aligned with business value can make improvement work irrelevant. section 14.4.1 section 17.0
A practical quality assessment should:
- Track accuracy and bias together rather than treating either as sufficient alone. section 17.0
- Compare model or process performance with a benchmark, such as a moving average, to measure added value. section 1.2.3 section 17.0
- Avoid relying on visual inspection at scale, generic industry benchmarks, or demand coefficient of variation as quality verdicts. section 10.0
- Use metrics calculated over matching periods; for percentage bias, divide average error by demand from the corresponding period. section 8.2.2
Is 36.1% MAE good enough?
A pharmaceutical manufacturer’s statistical forecast has historical MAE of 36.1% and bias of 1.6%. Those figures alone cannot establish whether the forecast is satisfactory. Demand randomness and complexity set the attainable error level, while the operational decision determines whether remaining error is acceptable. Compare the result with an appropriate baseline and the value at risk rather than accepting or rejecting it by intuition. section 10.0 section 17.0
Quality also depends on the forecasting process. Teams can share demand data and key demand drivers without forcing one reconciled number at every level. For example, an S&OP forecast at country-by-month level can coexist with a warehouse-by-week forecast for deliveries; planners can then review whether short-term forecasts remain in a reasonable range and incorporate major events such as price changes or special sales. section 7.4 section 17.0
Figure 10.1 The dashed forecast achieved an MAE of 36.1% and a bias of 1.6% (manufacturer in the pharma industry)
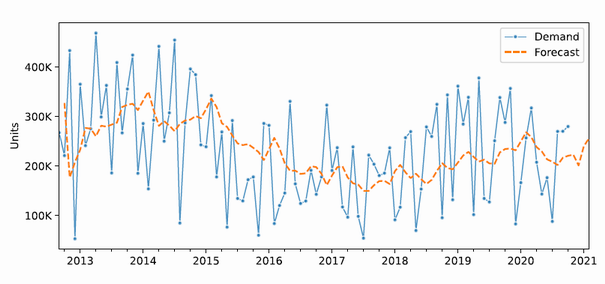
Inspect the demand history, dashed forecast, MAE, and bias together to see why numerical quality requires operational context. section 10.0
