When planners ask whether a product is easy to forecast, they may look at the coefficient of variation (COV), the ratio of standard deviation to mean: COV = σ/μ. Often expressed as a percentage, it measures variation around the historical mean—not unexpected future variation. section 10.2
COV can therefore mislead forecasting decisions. Trend and seasonality can produce high COV even when a suitable forecasting method predicts the product well. Historical COV also benefits from data leakage because it compares observations with a mean calculated using information from the same period. section 10.2.1 section 10.2.2
Treat COV as a descriptive variability measure, not a default forecastability score:
- Use it cautiously for flat, patternless demand, where it can provide a relatively good indication of overall forecastability. section 10.2.1
- Do not use it to rank products on an XYZ forecastability axis when demand contains trend or seasonality. section 13.2.2
- Assess forecastability with historical forecast errors against simple benchmarks such as moving averages. section 10.3 section 13.2.2
Why the same metric can misclassify products
A stable product provides a relatively favorable COV comparison with a moving-average benchmark. By contrast, products with an upward trend or seasonal pattern can show high COV while remaining easy to forecast with a moving average or seasonal moving average. section 10.2.1 section 10.2.2
Figure 10.6 COV vs. moving average for a product with trend
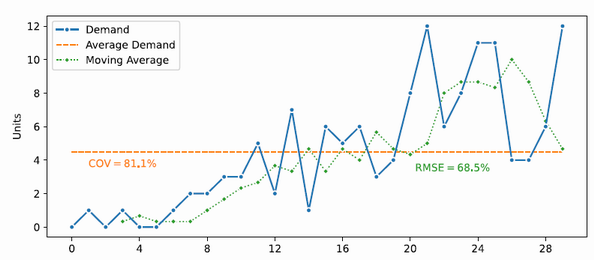
Compare COV with moving-average performance for a product with trend, where high historical variation does not establish poor forecastability. section 10.2.2
Figure 10.7 COV vs. seasonal moving average for a seasonal product
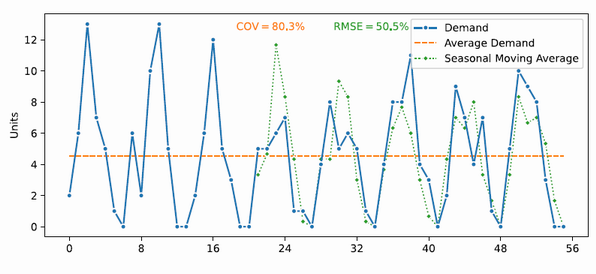
Inspect the seasonal example to see why COV can flag a structured, forecastable demand pattern as difficult. section 10.2.2
