liveBook · Manning

Fully labeled scale

As explained in Effective Data Analysis

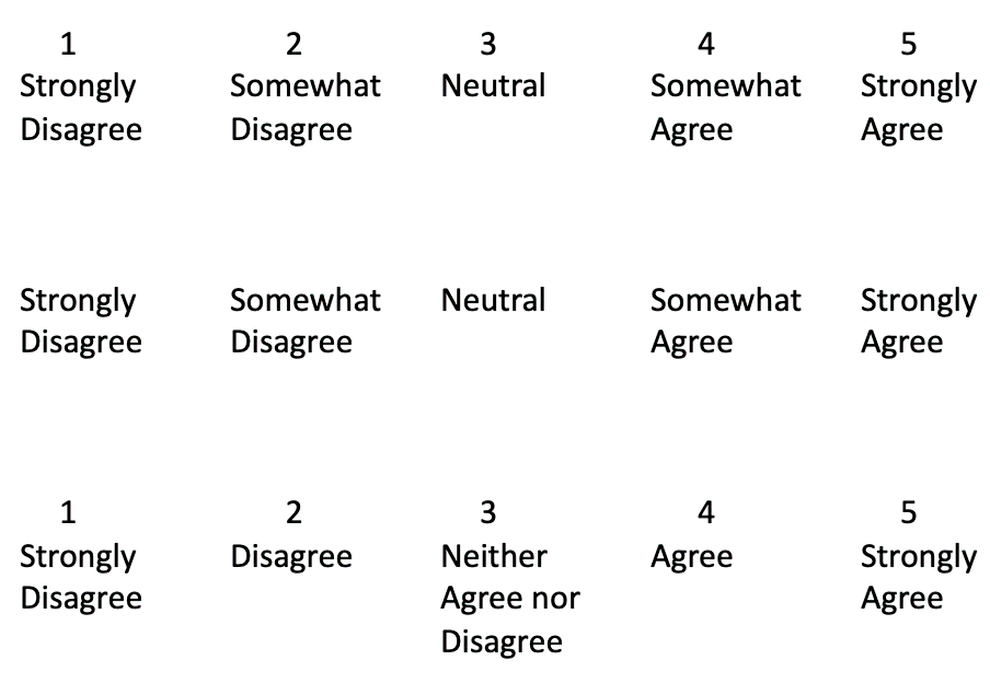
A fully labeled scale provides a verbal descriptor for the meaning of every response point.

A fully labeled scale gives every response point a verbal descriptor that clearly explains its meaning, rather than relying on numbers alone. section 6.2.2

This format can clarify response meanings, improve consistency and accuracy, and make surveys more accessible. In long surveys, however, reading every label can increase respondent fatigue. section 6.2.2

Related presentation choices include:

  • Partially labeled scales describe only endpoints and often the midpoint, reducing visual and cognitive load but leaving some response points open to interpretation. section 6.2.2
  • Fully labeled scales can also hide numerical points, emphasizing verbal meaning and removing respondents’ pre-existing associations with numbers. section 6.2.2
  • Keep descriptor order consistent across a survey because reversing options can affect responses. section 6.2.2
Figure 6.6 Varying methods of presenting the same response format
figure

Compare visual presentations of the same response format, including fully and partially labeled alternatives. section 6.2.2

How Effective Data Analysis covers it

How deep it goes
Defines labeling options, explains benefits and fatigue costs, and notes response-order effects without detailing statistical validation.
Examples
Uses “Strongly Agree” and “Strongly Disagree” descriptors, numerical response points, and visual comparisons of response formats.
What it assumes
Assumes familiarity with survey questions and response scales while explaining labeling choices from basic definitions.
What you can do after
Apply it by choosing verbal labels, numerical visibility, and consistent response ordering for survey questions.
How it connects
Connects scale labeling with self-report measures, partially labeled scales, Likert scales, response order, accessibility, and respondent fatigue.

Related concepts

This explainer was generated by Manning's knowledge graph from the text of Effective Data Analysis. The section links point to the parts of the book it draws on.