A functional constraint is a testable restriction on an observed probability distribution implied by a causal graph. Unlike ordinary d-separation, it can constrain independence between an observed variable and a function of observed variables even when the graph contains latent variables. section 4.5.1
For a graph containing cost C, smoking S, treatment T, lung-cancer status L, and latent D, h(L,C,T) combines P(L | C,S,T) with P(S | C) and sums over S. The graph implies that C and h(L,C,T) should be independent, creating a testable check without observing D. section 4.5.1
A practical testing workflow is:
- Derive constraints algorithmically from a DAG with latent nodes using causaleffect's verma.constraints or Y0's r_get_verma_constraints wrapper. section 4.5.2
- Fit P(L | C,S,T) and P(S | C), then implement h by multiplying corresponding probabilities and summing across S. section 4.5.3
- Attach h values to each data row and inspect independence from C with a box plot or ANOVA F-test. section 4.5.3
Cigarette cost and cancer data
Discretize cigarette cost into low, medium, and high categories, fit naive Bayes models for the two required conditional distributions, calculate h for every C–T–L combination, and compare h across cost levels. Overlapping box-plot distributions support the predicted independence; ANOVA supplies a corresponding p-value. section 4.5.3
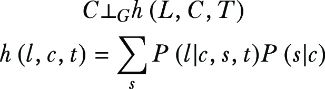
Use the causal graph to trace how latent structure produces a functional independence involving observed variables. section 4.5.1
