An observational joint distribution is the true probability distribution of variables as they arise through ordinary observation, without externally intervening on the system. It describes how complete combinations of observed values occur, such as whether Jenny throws a rock, Brian throws a rock, and a window breaks. section 2.3.2
Observed data provide an empirical joint distribution: the proportions of combinations in a finite sample. Sampling repeatedly from the observational distribution makes those proportions converge toward the underlying probabilities, but a small sample can contain no instance of an outcome that still has nonzero probability. section 2.3.2
Use the distribution to keep three probability objects distinct:
- Empirical joint distribution: finite-sample counts or proportions calculated from observed rows. section 2.3.2
- Observational joint distribution: the underlying distribution that generates those observed rows. section 2.3.2
- Full joint distribution: the joint distribution over observed and latent variables; marginalizing latent variables recovers the observational distribution. section 2.3.2
In causal analysis, observational data are samples from a level-one distribution, while an intervention query belongs to a higher level of the causal hierarchy. Identification therefore seeks a level-one estimand that can be computed from the observational distribution under an explicit causal model and its assumptions. section 11.3
Conditioning versus intervening
A language model can generate an observational sample conditioned on a Prince vignette, P(Kingdom|Prince=x), where observing the Prince constrains likely Kings. Applying a do-intervention fixes the Prince while removing the incoming causal edge, allowing greater variation in generated Kings and Kingdoms. section 13.3.3
Table 2.4 Assume this is the true observational joint distribution.
|
jenny_throws_rock
|
brian_throws_rock
|
window_breaks
|
probability
|
|
|---|---|---|---|---|
|
1
|
False
|
False
|
False
|
0.25
|
|
2
|
True
|
False
|
False
|
0.15
|
|
3
|
False
|
True
|
False
|
0.15
|
|
4
|
True
|
True
|
False
|
0.05
|
|
5
|
False
|
False
|
True
|
0.00
|
|
6
|
True
|
False
|
True
|
0.10
|
|
7
|
False
|
True
|
True
|
0.10
|
|
8
|
True
|
True
|
True
|
0.20
|
Inspect a concrete eight-outcome probability table for the assumed observational joint distribution. section 2.3.2
Figure 2.24 Sampling from the observational joint distribution produces the observed data and empirical distribution.
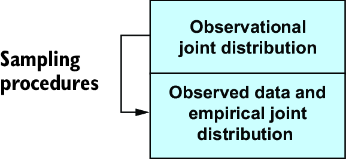
Trace how sampling from the observational distribution produces observed data and its empirical distribution. section 2.3.2
