Suppose a decision tree is choosing how to divide users so it can recommend an app. A useful question creates groups whose users mostly chose the same app. Gini impurity measures how mixed the class labels are in each group: a group with one label has impurity 0, while a more diverse group has a higher value. section 9.2 section 9.8
Imagine drawing two items at random from a group, allowing the same item to be drawn twice. Gini impurity is the probability that their labels differ. If pᵢ is the share with label i, the probability that both draws have that label is pᵢ². Add those same-label probabilities and subtract from 1: Gini = 1 − Σpᵢ². section 9.2
From colored balls to a tree split
For eight red and two blue balls, Gini = 1 − 0.8² − 0.2² = 0.32. Now compare two ways to divide six app users. Splitting by platform gives two groups with an average Gini impurity of 0.444; splitting by age gives 0.222. Age is the better first question by this measure. The still-mixed age group can then be split again. section 9.2
To choose a split, calculate Gini impurity for each resulting group, average the results, and prefer the lower value. When groups have different sizes, weight each impurity by that group’s share of the data. You can compare age cutoffs or yes-or-no questions about categories the same way. Accuracy and entropy offer other ways to compare splits; they need not be confused with Gini impurity itself. section 9.2 section 9.3
Figure 9.14 A split of a dataset of size eight into two datasets of sizes six and two. To calculate the average Gini index and the average entropy, we weight the index of the left dataset by 6/8 and that of the right dataset by 2/8. This results in a weighted Gini index of 0.333 and a weighted entropy of 0.689.
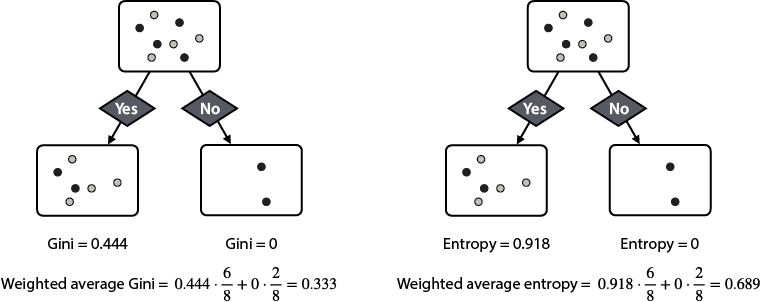
See how a split into groups of six and two weights their impurity values by 6/8 and 2/8, rather than treating the groups equally. section 9.2
Try it yourself: for a small set of labeled credit card transactions, compare a first split using transaction value with one using approved-vendor status. Compute each group’s Gini impurity, weight by group size, and choose the lower-scoring split. section 9.9 section 9.2




