A grid state is a two-dimensional visualization of a quantum state. Columns represent input or key-register outcomes, rows represent output or value-register outcomes, and each pixel or amplitude bar represents an outcome's amplitude. section 12.4 section 10.1.1
Use the grid to read and transform a state visually:
- Interpret pixel color as amplitude phase and intensity or bar length as amplitude magnitude. section 12.4
- Partition qubits into prefix and suffix registers, then reshape the one-dimensional state array into rows and columns. section 12.4
- For function encoding, read each column as an input and the nonzero row as its encoded output. section 10.1.1
- Visualize gates as recombinations of columns when the target lies in the prefix, or rows when it lies in the suffix. section 12.4
Visualizing an encoded function
Call grid_state(qc.run(), n_key, neg=False, show_probs=False) after preparing the circuit. The resulting grid displays encoded function inputs as columns and outputs as rows; enabling show_probs adds numeric probabilities beside amplitude bars. section 10.1.1
Figure 12.7 A three-qubit quantum state (top) and a four-qubit quantum state (bottom) illustrated as two-dimensional arrays of pixels
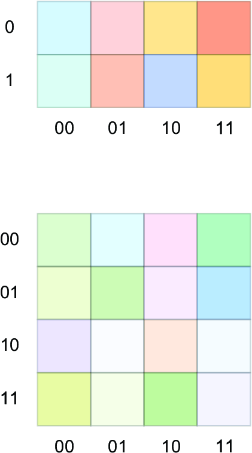
Compare one-dimensional pixel arrays with their two-dimensional grid arrangements for three- and four-qubit states. section 12.4
Figure 12.8 Visualizations of quantum transformations on different target qubits
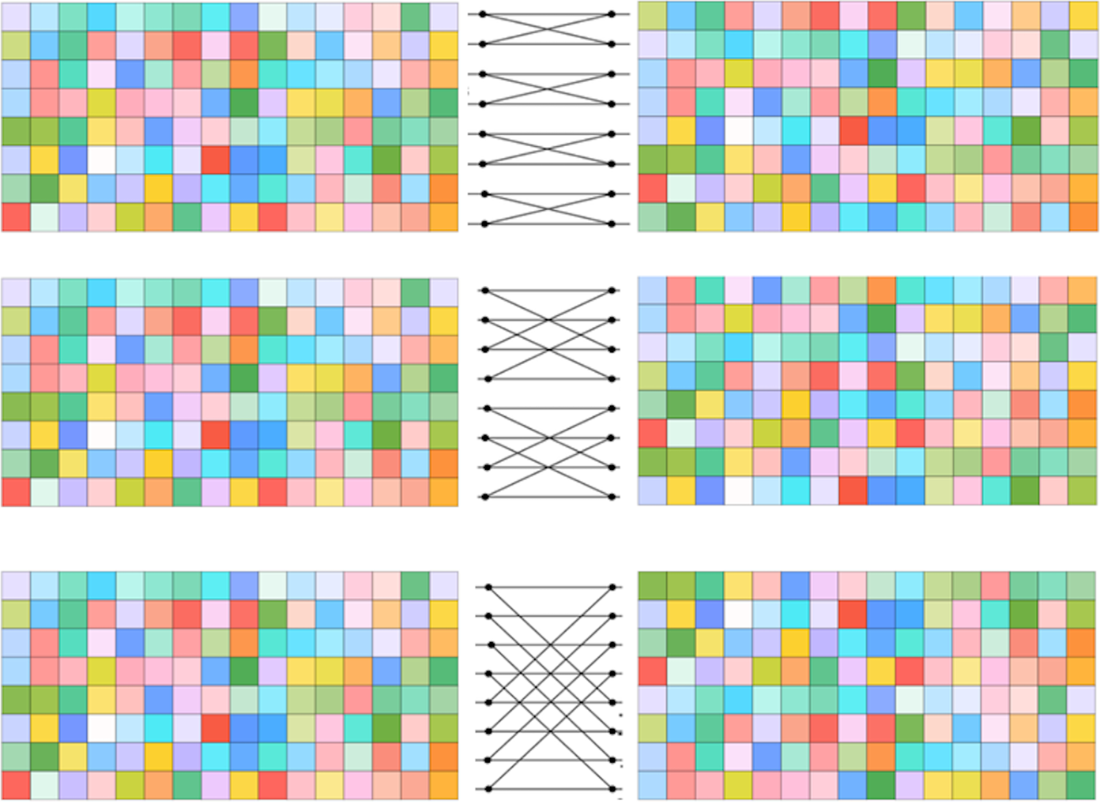
Inspect how applying gates to different target qubits changes rows or columns in the visual state representation. section 12.4
