Graph conductance measures how independently a subgraph is separated from the rest of its graph. It counts edges crossing the subgraph boundary relative to edges incident to the subgraph, producing a value from 0 to 1. Lower conductance indicates a tighter-knit, more independent community. section 4.2.3
A practical conductance analysis follows this pipeline:
- Extract the disease-associated proteins and their interaction edges into a subgraph. section 4.2.3
- Query interactions connecting pathway proteins to proteins outside the pathway and count distinct boundary edges. section 4.2.3
- Compare the boundary result with the pathway’s incident edges to interpret external connectedness. section 4.2.3
Disease pathways in a PPI network
Disease pathways have a median conductance of 0.96, indicating strong external connectivity despite higher internal density than the overall PPI network. Conductance distributions help compare pathway organization across diseases. section 4.2.3
Figure 4.7 Distributions of the three key measures for disease pathways
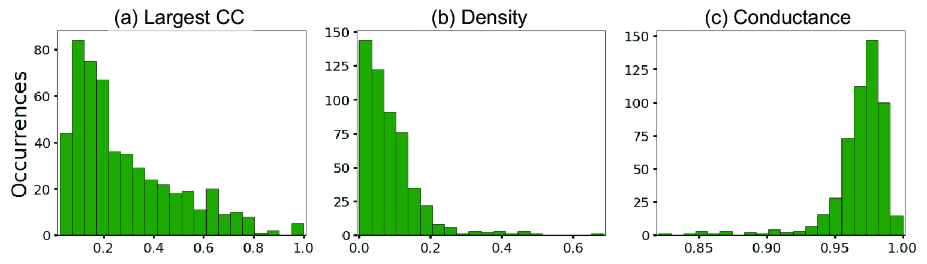
Inspect the conductance distribution alongside pathway density and largest-component size. section 4.2.3
