A hammer is a candlestick pattern with a small body and long lower wick. After a downtrend, it may indicate a potential reversal. section 10.2.1 section 10.4
Read the hammer through its candlestick components:
- Interpret the long lower wick as rejection of, or support near, lower price levels. section 10.2.1
- Treat the small body as limited separation between opening and closing prices, rather than strong momentum. section 10.2.1
- Use the pattern to discuss a possible change after declining prices, not as a guaranteed forecast. section 10.2.1
Figure 10.20 Various candlestick patterns in which we can describe the behavior of the market. In addition to the Doji, Hammer, and Engulfing patterns, we can see the volatility of prices. You immediately realize that candles with long bodies represent high volatility, whereas candles with multiple short bodies represent a calm market situation.
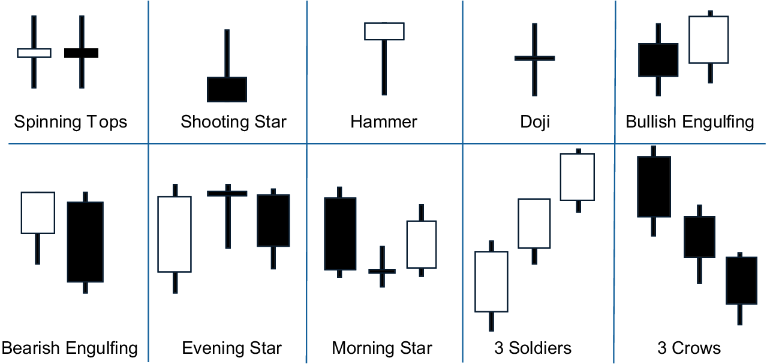
Compare the Hammer with Doji and Engulfing patterns while relating body size and wick structure to market behavior. section 10.2.1
