The hot hand phenomenon is the claim that success in a sequence makes the next success more likely. For a basketball player, that means a made free throw should raise the chance of making the next one. The idea is contrasted with independent trials, where each outcome has the same probability regardless of earlier makes or misses. section 16.3 section 20.6
A proposed hot-hand pattern resembles a Laplace probability curve: after a run of makes, estimated success percentage climbs rather than immediately regressing toward a typical rate. This is only a pattern to investigate, not proof that a streak caused the next shot. section 16.0 section 16.3
A practical free-throw analysis tests the claim by:
- Keeping attempts separate by player and game, since a streak is treated as a within-game sequence. section 16.4.1 section 16.6
- Computing consecutive prior makes with runner::streak_run() and dplyr::lag(), then removing each game’s first attempt because it has no prior shot. section 16.4.1
- Grouping attempts by streak length, tallying makes and misses, and calculating the resulting free-throw percentage. section 16.4.1
- Plotting percentage against streak length and comparing its shape with the rising Laplace curve and with simulated coin flips. section 16.3 section 20.6
Giannis Antetokounmpo: streaks are not enough
For 2019–20 free throws, percentages rose from 61.7% after one prior make to 77.1% after four, but then fell to 66.7% and 60% after streaks of five and six. Later streaks have very few attempts, so their 100% values do not establish a steadily increasing curve. A 700-flip simulation produced streak lengths resembling this player-level pattern. section 16.4.1 section 20.6
Julius Randle: a counter-pattern
Randle made nearly 80% of free throws after one prior make, then stayed below 70% from streak lengths two through six. The plotted results do not resemble a Laplace probability curve, so they provide no evidence of a hot hand in this analysis. section 16.4.2
Figure 16.2 Giannis Antetokounmpo’s free throw percentages following consecutive makes during the 2019-20 season
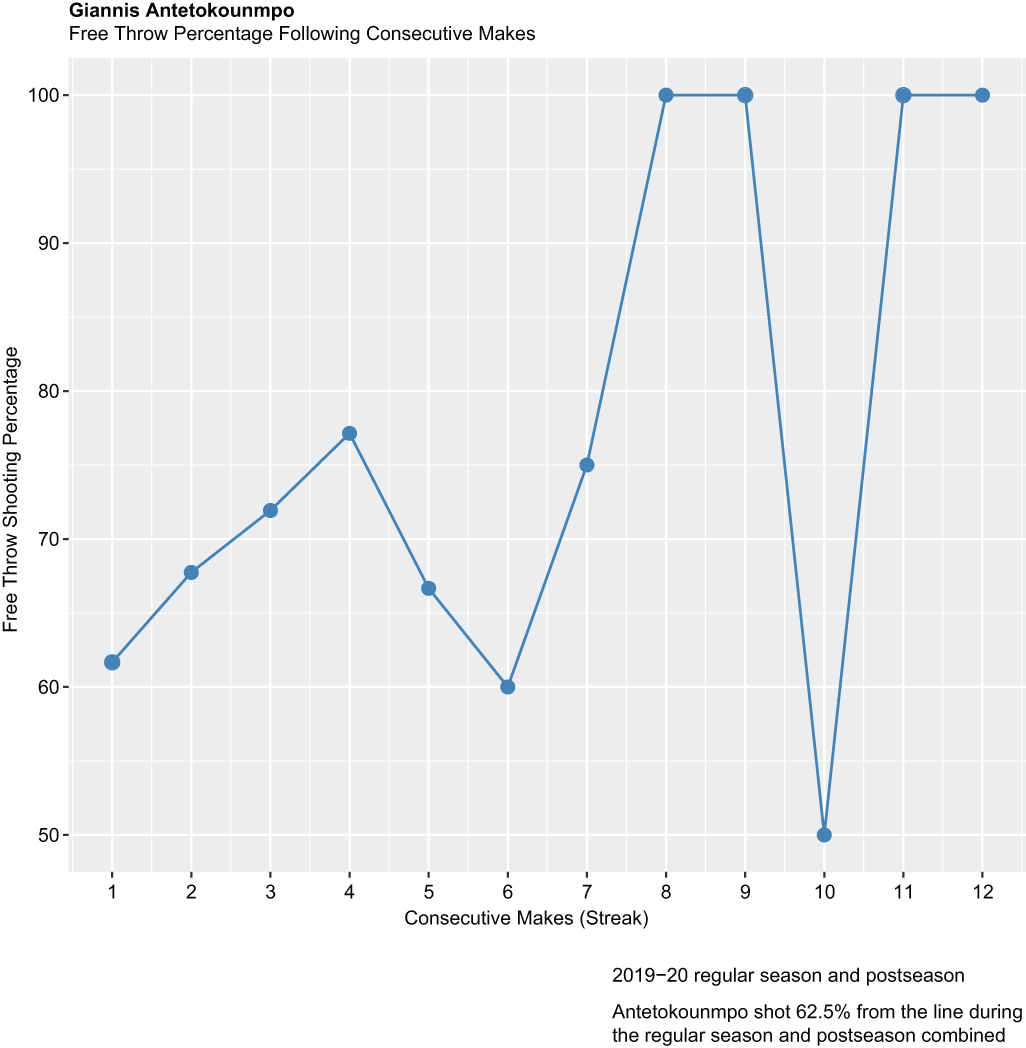
This line chart makes the test visual: a hot-hand case would show a broadly rising percentage as consecutive makes increase, while irregular movement argues against that pattern. section 16.4.1
Across the examined player-level results, free-throw shooting appeared more like random coin flips than persistent momentum. Combining many players can create a more Laplace-like league-wide curve, but that aggregation is less meaningful for a phenomenon defined around one individual in a discrete period. section 16.6 section 20.6
