An intervened graph represents what would happen after deliberately setting a variable to a value. To model do(T = A), remove every arrow pointing into treatment T and fix T to A. The resulting graph defines the intervention distribution P|do(T = A), rather than the observed distribution P|T = A. section 2.2.4
This distinction separates a decision from an observation. P|T = A describes patients who happened to receive treatment A; P|do(T = A) describes the hypothetical result of giving treatment A to everyone. The graph therefore turns a causal question into a formal model. section 2.2.4
Choosing a kidney-stone treatment
Suppose confounder C affects both treatment T and outcome O. Forcing T to t removes C → T while retaining the pathways from T to O, producing the graph for P(O|do(T = t)). In a randomized trial, no confounder points into T, so the observed and intervened graphs coincide: P(O|do(T = t)) = P(O|T = t). section 2.5.1 section 2.2.4
Figure 2.6 Data-generation process producing the intervened probability distribution P|do(T = A), which models what would happen if we gave treatment A to every patient
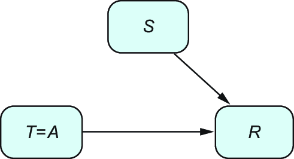
Use the intervention diagram to visualize how assigning treatment A to every patient changes the data-generating process and produces P|do(T = A). section 2.2.4
A conditional intervention targets a subgroup, such as patients with confounder value Z = z, and expresses its effect as P(O|do(T = t), Z = z). This shortcut is unsafe when the subgroup is defined by a post-treatment mediator, where counterfactual reasoning is required. section 2.5.8
