An investment horizon, or time horizon, is the period over which an investment is expected to remain invested or be evaluated. It sets the time available for returns, losses, taxes, and investment decisions to play out. A longer horizon can support greater confidence in an expected long-run return, while short-term results can differ substantially from that expectation. section 14.1.1
For tax-loss harvesting, horizon is a practical input rather than a background detail. Deferring tax creates value only while the deferred amount remains invested. If liquidation occurs in the same tax year, the deferral benefit is generally zero because taxes are normally due at year-end. A horizon under one year also prevents rate conversion: replacement assets must be held at least a year for eventual gains to receive long-term tax treatment. section 14.1.1 section 14.1.3
Use the planned horizon to test assumptions behind an investment decision:
- Choose a discount rate that is reasonably achievable over the relevant period; higher expected returns may bring higher risk. section 14.1.1
- Check whether a planned sale or cash need occurs before the tax benefit can accrue, especially within the current tax year or before one year has passed. section 14.1.3
- Compare the current tax rate with the expected tax rate when assets will be sold; deferral can be unattractive when the later rate is higher. section 14.1.3
- Treat a longer horizon as greater risk capacity when assessing portfolio risk, alongside cash needs and other assets. section 2.5
A short horizon can erase a harvesting benefit
Suppose an investor harvests a loss but expects to liquidate the portfolio within the same tax year. The tax payment is still generally due at year-end, so delaying the tax produces practically no benefit. If the investor instead needs to sell within a year, the holding period is also too short to obtain long-term treatment on gains in replacement assets. section 14.1.3
Figure 2.5 A slider used to visualize the effects of changing the stock–bond mix
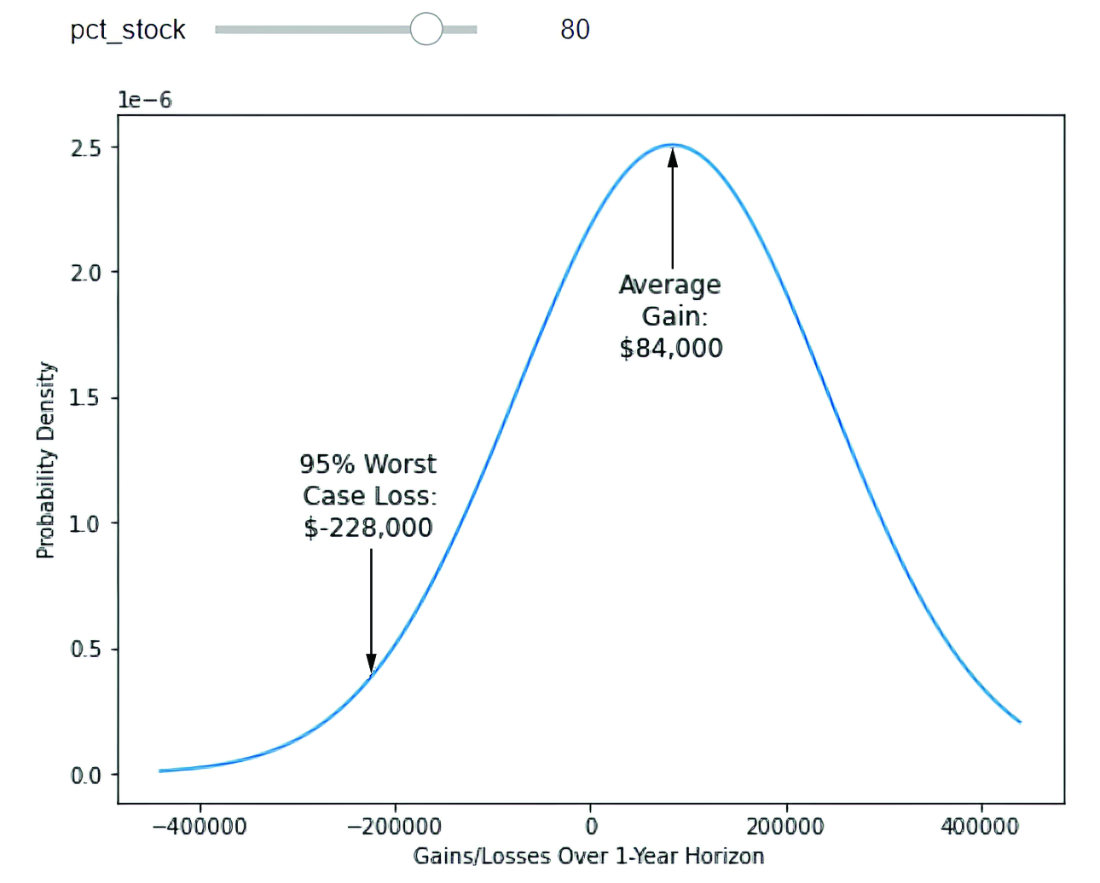
This slider visualizes one-year gains and 95% worst-case losses for a $1 million stock–bond portfolio, making a specified horizon concrete when judging risk capacity. section 2.5
