A leading indicator provides early evidence about the likelihood of a later outcome. Engineering success can signal progress, but it matters only when it contributes to eventual business success. section 3.1.4 section 10.1.2
Platform teams use leading indicators alongside lagging outcomes such as DORA metrics. The early measures expose bottlenecks, quality risks, and opportunities for automation before production results reveal them. section 10.1.2
Useful leading indicators connect operational activity to later delivery and reliability outcomes:
- Deployment frequency: percentage of automated deployments and deployment frequency per team can reveal bottlenecks affecting successful deployments. section 10.1.2
- Lead time for changes: time spent in build, test, and approval stages identifies where delivery is slowing. section 10.1.2
- Change failure rate: code-quality violations, test coverage, and the ratio of manual to automated tests provide early warnings before production failures. section 10.1.2
Platform measurement at Epetech
Epetech aligned platform KPIs with its value model and the DORA four key metrics. Rather than waiting for deployment, lead-time, or failure results, the team monitored automation, pipeline stages, code quality, and testing to target improvements earlier. section 10.1.2
Figure 10.2 Key leading metrics used by Epetech to understand and use the DORA lagging metrics
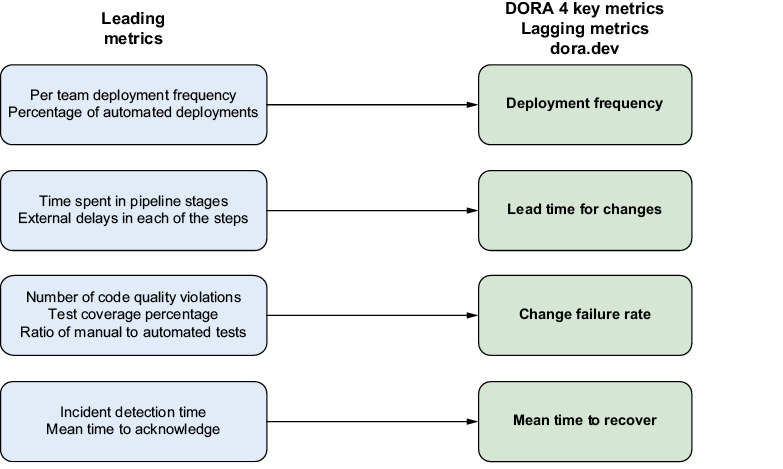
Use the figure to relate leading metrics to the DORA lagging metrics they help explain and improve. section 10.1.2

