Load testing deliberately sends simulated traffic to a deployed service before real demand exposes its weak points. For a RAG chat application, the aim is not merely to make it fail: it is to measure behavior under concurrent queries, identify the constrained component, and make a targeted scaling decision. section 5.4 section 5.0
Start with observability. Add logging at key functions—such as agent construction, query execution, retrieval, and result storage—so a test can be traced through the application. Logs and metrics turn latency spikes, errors, and throttling into evidence rather than guesswork. section 5.4.1 section 5.4.3
A practical load-testing loop is:
- Deploy a reachable, monitored endpoint and record baseline behavior. section 5.0
- Define representative virtual-user behavior, including connection, request sending, response waiting, random pauses, reconnects, and clean shutdown. section 5.4.2
- Increase simulated users and their interaction rate from the Locust web interface while watching requests per second, response times, and failure rates. section 5.4.2
- Inspect logs and failures, locate the strained service, then adjust only the relevant capacity or quota. section 5.4.3
- Repeat deploy, observe, load-test, and adjust as demand changes. section 5.4.3
Testing a WebSocket chat service with Locust
Install Locust and websocket-client, then define a Python ChatUser that opens a secure WebSocket, sends a JSON chat payload, times connect/send/receive actions through Locust events, waits briefly between requests, reconnects after socket failures, and closes the socket on shutdown. Run Locust, set user count and spawn rate in its local dashboard, and compare latency and failures as concurrency rises. section 5.4.2
Treat failures as capacity signals. Slow or failing search requests can indicate AI Search throttling and motivate a higher service tier; traffic pressure on the web application can call for more App Service instances; rate limits can require increased model request capacity. Each remedy has cost implications, so use observed evidence to scale the component that is actually strained. section 5.4.3 section 5.5
Figure 5.5 We will add logging to our file to catch any errors, then run Locust to simulate users and cause our app to fail. We will use the Locust dashboard and logs to find bottlenecks so we can fix them.
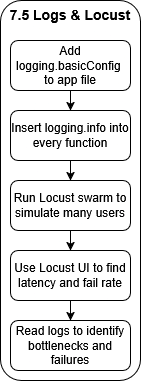
Use the workflow figure to connect instrumentation, simulated-user failures, dashboard results, and bottleneck remediation into one operational loop. section 5.4.1