A logarithmic scale makes equal visual intervals represent equal multiplicative ratios rather than equal additive differences. It helps display values spanning several orders of magnitude, such as population growth, while making exponential change appear linear. section 7.3.2
Use logarithmic scales carefully:
- Prefer them when a linear scale cannot make the full range interpretable. section 7.3.2
- Explain the scale clearly to stakeholders because it can distort perceptions of variation and make trends appear more linear. section 7.3.2
Figure 7.25 Logarithmic scales can help visualize metrics with exponential fluctuations in the data, but they should be used with caution.
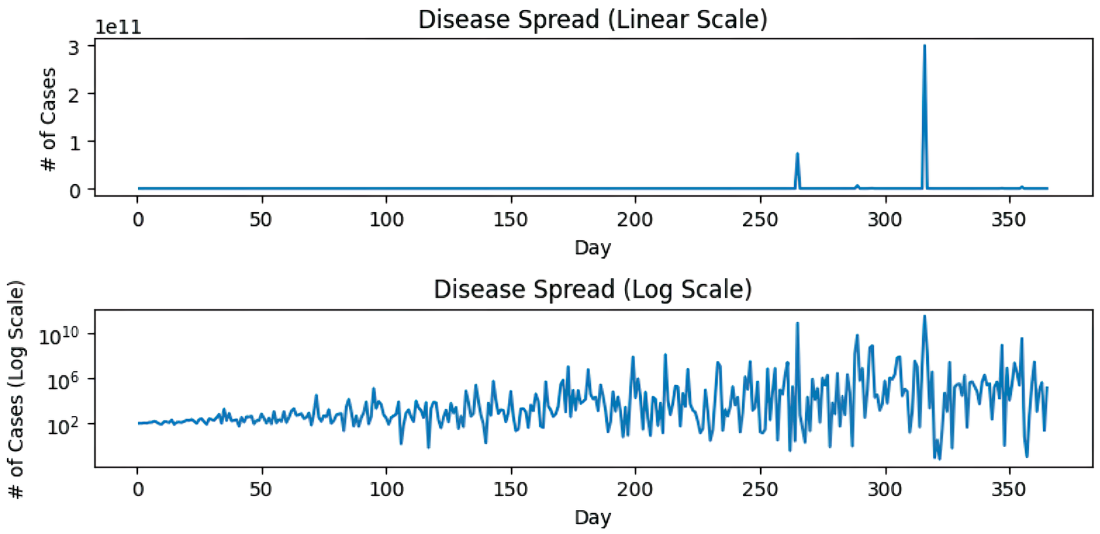
Use the figure to compare how logarithmic scaling represents metrics with exponential fluctuations and why cautious interpretation matters. section 7.3.2


