A power-law relationship describes one quantity as proportional to a constant power of another. Unlike a linear relationship, its results are nonlinear and can grow sharply rather than changing at a constant rate. section 16.3
Power laws help describe heavily uneven outcomes. A Pareto distribution is a nonlinear probability distribution associated with the 80-20 rule: a small share of causes may account for a large share of results. section 15.0
Common analytical uses include:
- Describe right-skewed distributions in which many observations cluster at low values while a small number extend far into the right tail. section 15.0
- Test whether a small group accounts for a disproportionately large share of activity, such as games played or won. section 15.0
- Distinguish apparent streak-based order from regression to the mean and avoid confusing randomness with causality. section 16.3
NBA franchises and the 80-20 rule
Count NBA franchise years from 1946 through 2020 and examine the distribution. Most franchises existed for only a few years, while fewer lasted much longer, producing a right-skewed pattern consistent with a Pareto distribution. A Pareto chart can then compare franchise-level totals with cumulative frequencies. section 15.0
Figure 15.1 The distribution of NBA franchises visualized by number of years in the league; when the Lindy effect applies, we’ll see a right-skewed, or positive-skewed, distribution. Thus, the Lindy effect corresponds to a Pareto probability distribution that is closely aligned with the 80-20 rule.
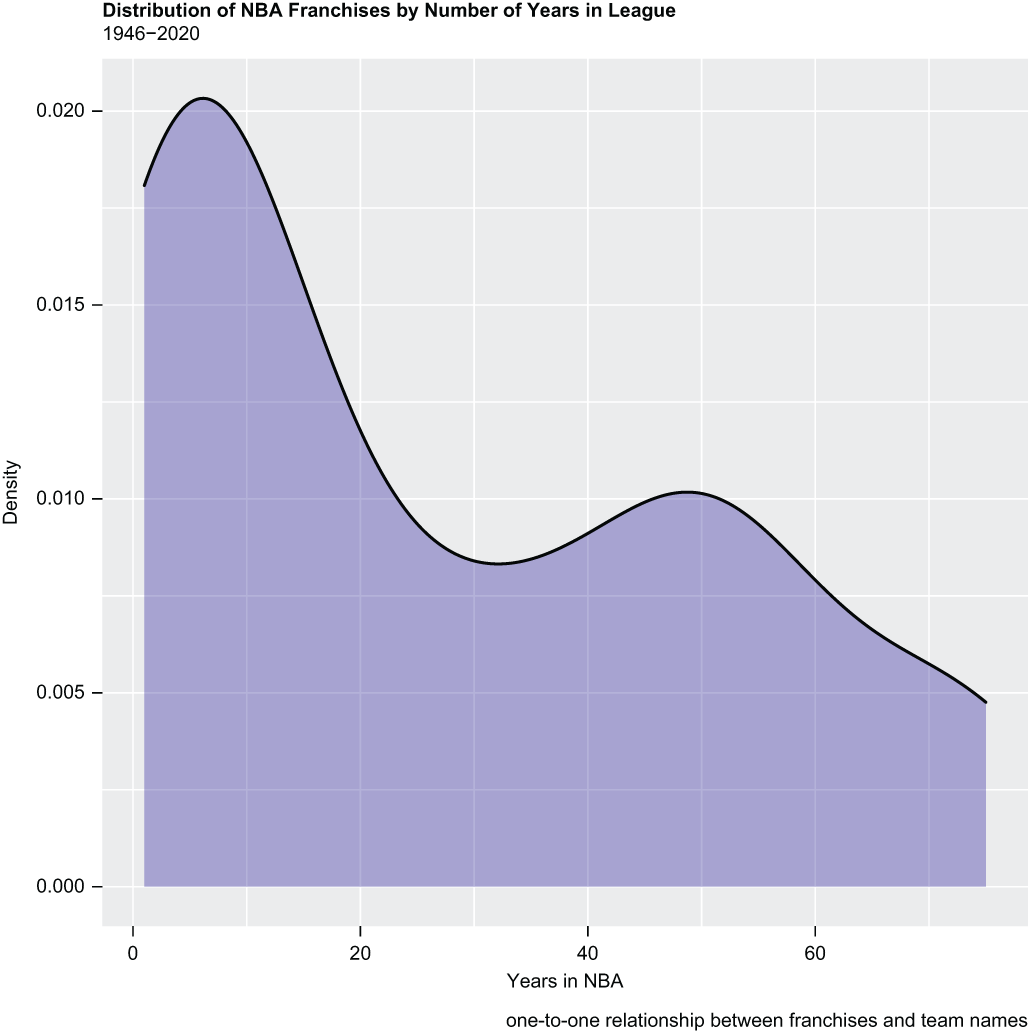
Use the distribution figure to inspect the right-skewed shape associated with the Pareto form and the Lindy effect. section 15.0
