Long data stores one observation per row: a measurement or an entity’s participation in an event. Repeated attributes that would occupy separate columns in a wide table become values in shared columns, while identifiers and context remain alongside each observation. section 3.1.1
Choose the structure for the analytical question, not as a cosmetic cleanup. Long data can make it easier to compare categories, change granularity, and build cross-tabulations; the resulting model should capture transformations that would otherwise be repeated for every analysis. section 3.1.1 section 6.4.2
Representing football results
A wide match record has separate Home team, Away team, Home goals, and Away goals columns. A long version uses two rows per match: one for each team, with a Home or away? value and a Goals scored value. Match details such as date, competition, and round are repeated for both participants. section 3.1.1
For multiple-choice survey responses, first turn selections into indicator columns, then gather each selected option’s counts by response category into a long table. That table can be reshaped into percentage cross-tabs and displayed as a heatmap, making comparisons across use cases easier to inspect. section 6.4.2
Table 3.2 The same football results in a long format, one row per match participant
|
Match ID
|
Date
|
Competition
|
Round
|
Team
|
Home or away?
|
Goals scored
|
|---|---|---|---|---|---|---|
|
1
|
2014-07-04
|
World Cup 2014
|
Quarter-final
|
France
|
Home
|
0
|
|
1
|
2014-07-04
|
World Cup 2014
|
Quarter-final
|
Germany
|
Away
|
1
|
|
2
|
2014-07-04
|
World Cup 2014
|
Quarter-final
|
Brazil
|
Home
|
2
|
|
2
|
2014-07-04
|
World Cup 2014
|
Quarter-final
|
Colombia
|
Away
|
1
|
|
3
|
2014-07-05
|
World Cup 2014
|
Quarter-final
|
Argentina
|
Home
|
1
|
|
3
|
2014-07-05
|
World Cup 2014
|
Quarter-final
|
Belgium
|
Away
|
0
|
Compare the two participant rows for each match with the single wide match record: team role and goals are values rather than paired home/away columns. section 3.1.1
Figure 6.38 A snapshot of long-format data comparing AI tool use case options with trustworthiness
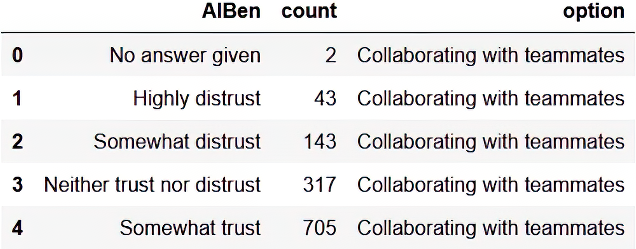
Inspect a long-form survey artifact in which AI tool-use options are paired with trustworthiness response counts before cross-tabulation. section 6.4.2

