liveBook · Manning

Longitudinal study design

As explained in Effective Data Analysis

A longitudinal study design assesses participants repeatedly at multiple points over time to identify changes or trends.

A longitudinal study design assesses participants repeatedly at multiple points over weeks, months, years, or longer to identify changes and trends in a dependent variable. It can combine within-subjects and between-subjects comparisons, including treatment groups or cohorts. section 3.2.4

Use the design to:

  • Detect changes that a simple before-versus-after comparison might miss. section 3.2.4
  • Compare trends between mutually exclusive cohorts, randomly assigned groups, or treatment and control groups. section 3.2.4
  • Select repeated-measures tests for limited time periods, or specialized methods such as survival analysis and growth curve analysis for longer follow-up. section 3.2.4

Tracking blood pressure over time

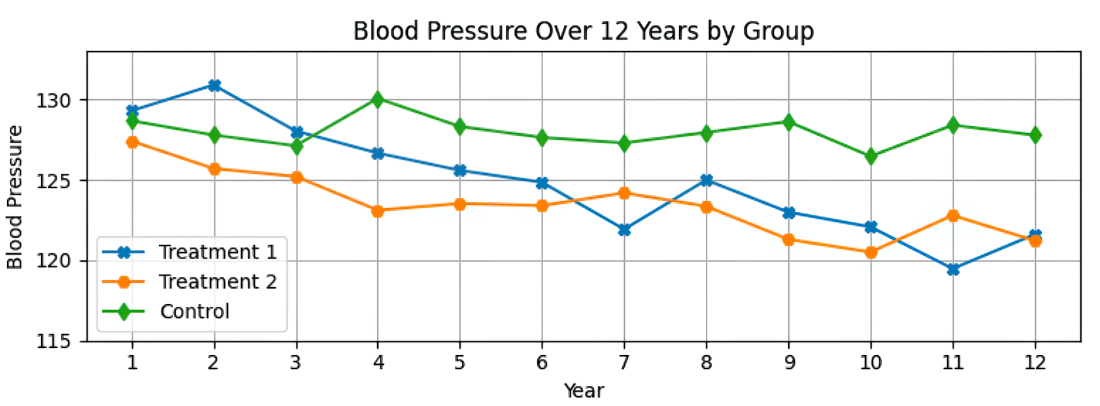
A study can measure blood pressure weekly for twelve weeks across three age cohorts, or annually for twelve years across two treatment groups and a control group. section 3.2.4

Figure 3.13 Longitudinal comparisons evaluate participants over months, years, or even lifetimes.
figure

Use the figure to visualize repeated evaluation across months, years, or lifetimes. section 3.2.4

How Effective Data Analysis covers it

How deep it goes
Defines repeated measurement and comparison structures, then points to specialized analysis without developing those methods.
Examples
Uses blood-pressure measurements, multi-year pharmaceutical trials, and geographical cohorts tracking spending over a calendar year.
What it assumes
Assumes familiarity with independent and dependent variables and basic between-subjects and within-subjects comparisons.
What you can do after
Evaluate changes and trends across time using comparisons suited to participants, cohorts, treatment groups, and follow-up duration.
How it connects
Connects within-subjects comparisons, between-subjects comparisons, cohort study designs, repeated-measures tests, survival analysis, and growth curve analysis.

Related concepts

This explainer was generated by Manning's knowledge graph from the text of Effective Data Analysis. The section links point to the parts of the book it draws on.