Loss aversion describes the tendency to focus more strongly on losses than comparable gains. Portfolio analysis makes this practical by displaying both outcomes in dollar terms. section 2.5
A stock–bond allocation slider
For a $1 million portfolio, an interactive slider varies the stock allocation from 0% to 100%. Each setting shows average gain and the 95% worst-case loss. Increasing stocks raises both the modeled average return and maximum loss, making the trade-off easier to evaluate. section 2.5
Figure 2.5 A slider used to visualize the effects of changing the stock–bond mix
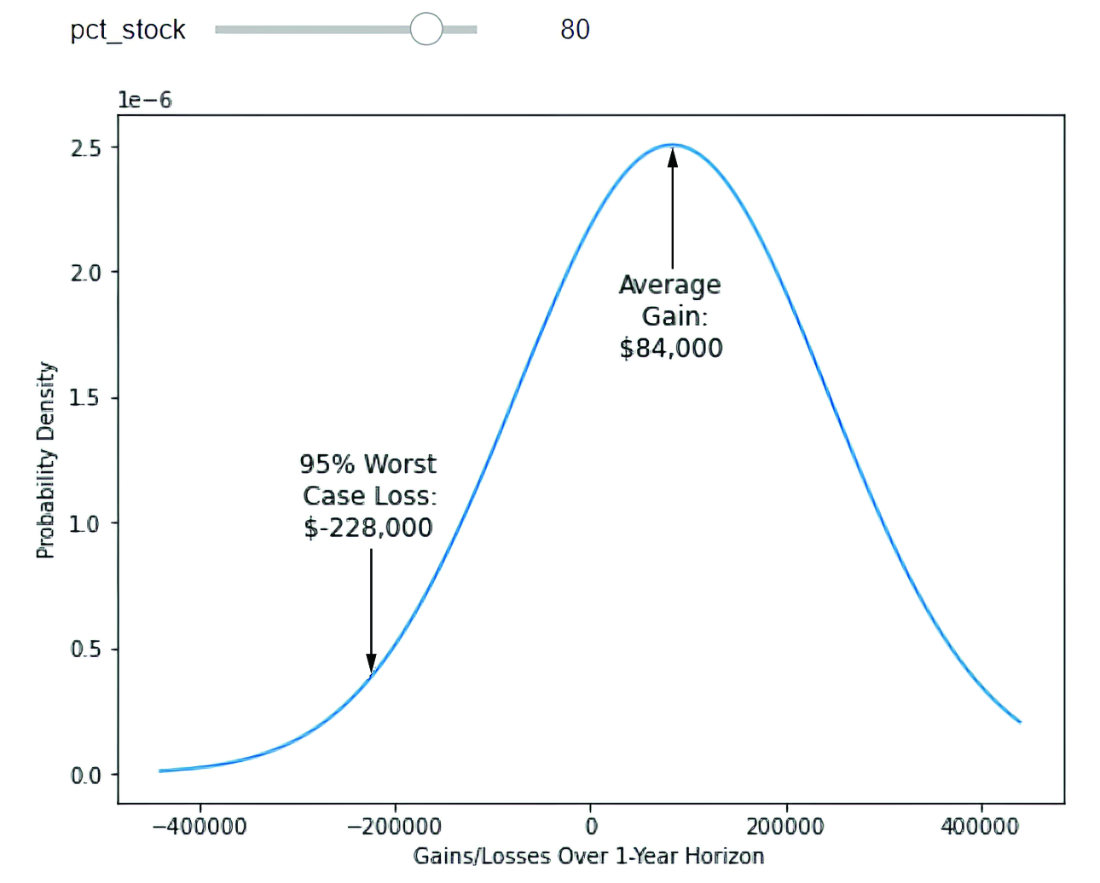
Explore how changing the stock–bond mix changes modeled gains and worst-case losses. section 2.5
The calculation emphasizes three practical choices:
- Measure downside as the 95% worst-case loss, defined as 1.96 standard deviations from the average. section 2.5
- Use dollar gains and losses rather than percentages when communicating portfolio risk. section 2.5
