A loss surface maps model parameter values to their loss. Before AlexNet, researchers often pictured it as terrain riddled with poor local minima and saddle points, making deep-network training seem unstable. That picture overlooked how loss surfaces behave in high-dimensional spaces. section 2.4 section 2.5.4
Figure 2.2 The challenge of optimizing functions shaped like long, narrow valleys. The contour lines represent a valley, with the optimal direction of progress indicated by an arrow running along the valley’s base. Smaller arrows represent steps taken by gradient descent: the left diagram shows large steps oscillating inefficiently across the valley, while the right diagram shows small steps making slow progress along the base. The “pathological” nature does not arise from high or low curvature, but from the combination of high curvature across the valley and low curvature along it. Used with permission granted by the author (James Martens).
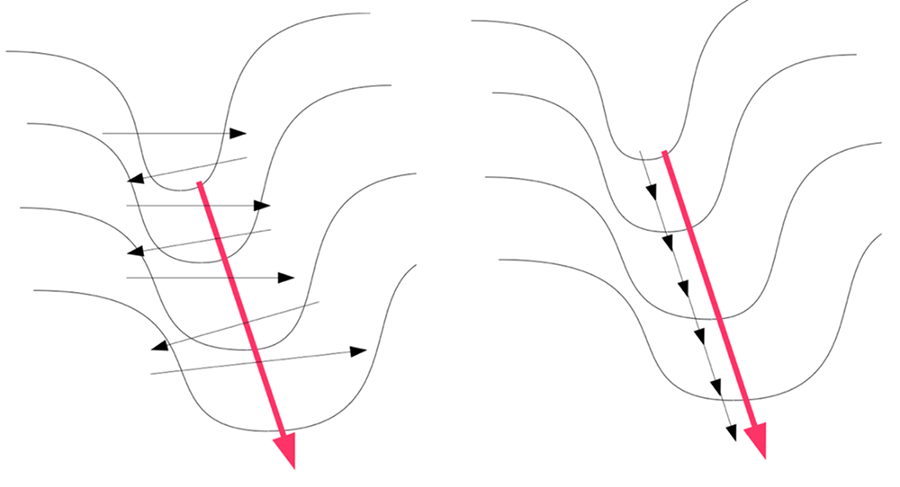
A long, narrow valley shows why gradient descent can make inefficient progress: large steps oscillate across the valley, while smaller steps move slowly along its base. section 2.4
AlexNet’s mini-batch gradient averaging further smoothed irregularities in the loss landscape, supporting more stable optimization. The landscape metaphor helps explain why training behavior depends not only on local minima but also on dimensionality and the shape of the terrain. section 2.5.4 section 2.4

