Manual exploratory data analysis is analyst-directed, methodical examination of data through individually selected summaries, visualizations, and analytical commands. It makes the analyst think carefully about what the data might reveal and creates a substantial learning opportunity, rather than simply returning a predetermined collection of results. section 17.6
A practical manual EDA workflow can include:
- Prepare a focused data set by selecting relevant variables and creating derived measures with data-wrangling functions. section 17.4.2
- Inspect structure, missingness, distributions, relationships, and categorical counts with deliberately chosen tabular and graphical techniques. section 20.9 section 17.4.2
- Combine manual investigation with selected automated functions when automation can complement, rather than replace, analytical judgment. section 17.6
Comparing opening and closing betting totals
For NBA game odds, create oddsdf3 from oddsdf2, calculate total points from road and home scores, measure each total against the opening and closing lines, and classify line movement as up, down, or same. A further variable records whether the opening or closing total was closer to the actual score. Profiling and plots then help examine the resulting data. section 17.4.2
Figure 20.9 We computed summary, or descriptive, statistics in every chapter and then visualized the same by demonstrating a wide range of plotting techniques. However, the manual EDA exercises in chapters 2, 5, 6, 10, and 14, plus the automated EDA demonstrations in chapter 17, were more exhaustive than like efforts from other chapters.
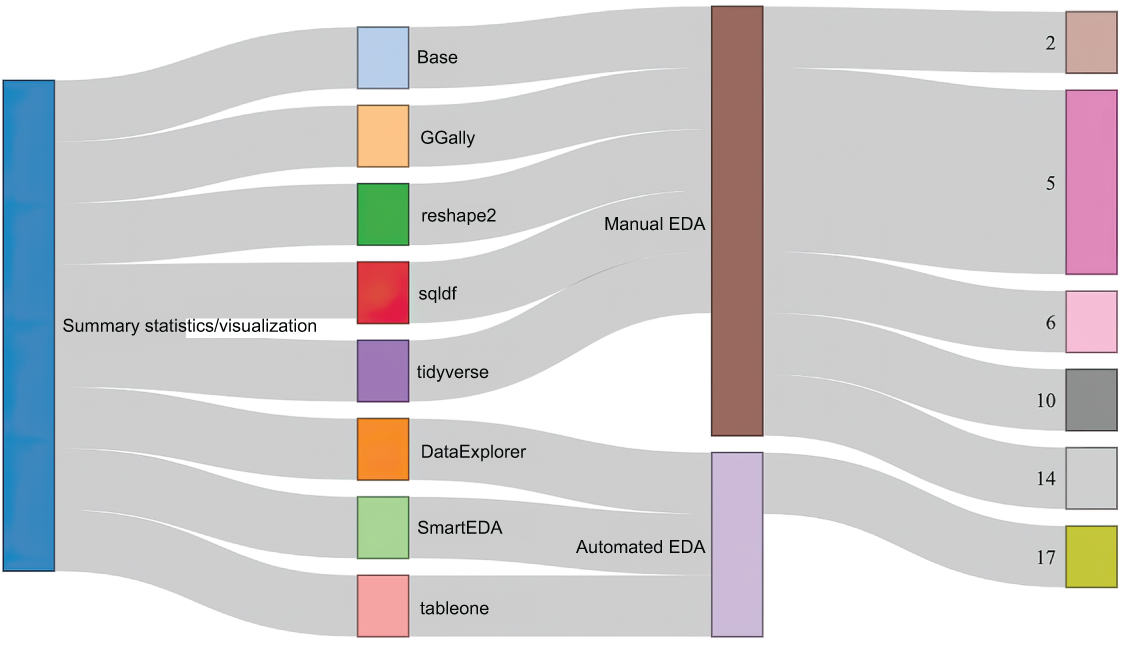
A visual map shows where summary statistics, visualization, manual EDA, and automated EDA fit across the broader analytical workflow. section 20.9
