Market share compares each distributor’s revenue with the total revenue in a defined market and period. Annual distributor data can reveal which companies gained or lost position after the lockdown period. section 5.4.3
A practical market-share analysis follows a small set of checks and transformations:
- Inspect distributor rows, years, release counts, and total gross box-office revenue before analyzing shares. section 5.4.3
- Verify that market-share values approximately total 100% for every year, allowing for documented rounding errors. section 5.4.3
- Standardize entity names, including duplicate labels for 20th Century Fox, Entertainment One, and aggregated Other categories. section 5.4.3
- Group by year and distributor, pivot distributors into columns, and plot consistent entities as lines over time. section 5.4.3
Comparing distributors across the lockdown period
A distributor table can contain separate labels for the same company and inconsistent Other categories. After standardizing names, retain distributors present in every year, aggregate market share by year and distributor, and chart the resulting time series. The result supports a focused question: which distributor emerged from the lockdown period with the strongest market position? section 5.4.3
Figure 5.4 The first step and decision point in the analysis
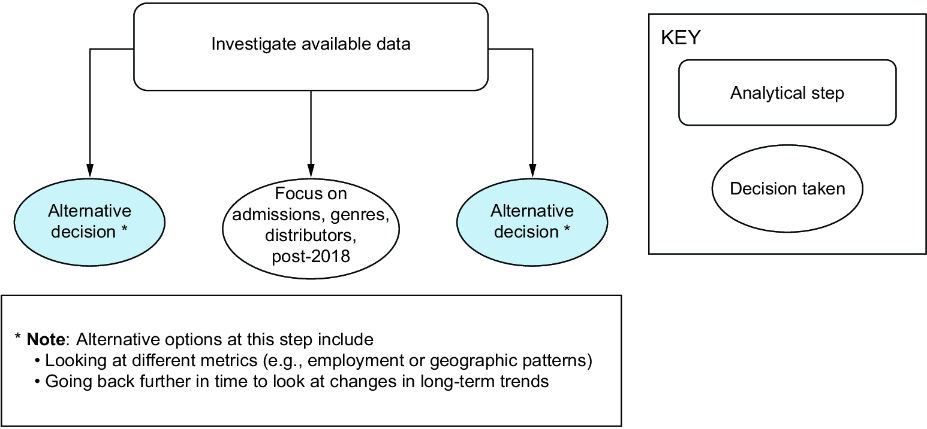
Use the decision-point view to connect market-share analysis with the broader choice of analytical categories and available data tables. section 5.4.1

