Masking occurs when one or more extreme outliers distort the mean and standard deviation enough that other outliers no longer appear unusual. It is especially pronounced with z-score detection, though outliers can undermine many detection methods. section 2.1.1
Masking differs from the related swamping effect:
- Hides an outlier such as point B because a more extreme point A changes the estimated mean and standard deviation. section 2.1.1
- Contrasts with swamping, where an extreme point makes another value, such as point C, appear anomalous when it otherwise would not. section 2.1.1
- Warns that detector performance may depend on the training data, particularly when clustering is sensitive to extreme values. section 8.5.5
Extreme values in detector training
Adding ten extreme values to training data left IF and LOF AUROC scores nearly unchanged but reduced CBLOF from 0.79 to 0.52, equivalent to random guessing. Cleaning strong outliers before fitting can help, but the cleaning process and detector robustness should be tested. section 8.5.5
Figure 2.2 A swarm plot with at least one outlier, point A. Depending on the presence of A, points B and C may or may not be flagged as outliers, as A can affect the mean and standard deviation.
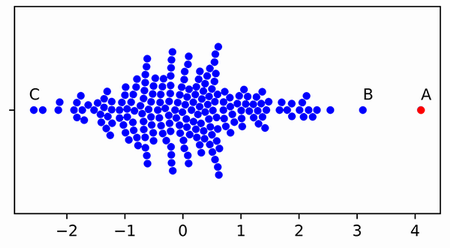
Use the swarm plot to see how the presence of point A changes whether points B and C are flagged. section 2.1.1
