A z-score test detects unusual numeric values by measuring each value’s distance from the mean in standard deviations. It flags values whose absolute z-score exceeds a chosen threshold. section 2.1.1
Apply the test by:
- Calculating the mean and standard deviation of the values. section 2.1.1
- Computing each value’s z-score as its number of standard deviations from the mean. section 2.1.1
- Flagging values whose absolute z-score exceeds a selected cutoff; 3.0 is common but conventional rather than universally correct. section 2.1.1
Example values
For values with mean 6.6 and standard deviation 10.04, the value 34 has a z-score of 2.73. A 3.0 cutoff flags none, although 34 may be considered unusual in a larger comparable dataset. section 2.1.1
Figure 2.2 A swarm plot with at least one outlier, point A. Depending on the presence of A, points B and C may or may not be flagged as outliers, as A can affect the mean and standard deviation.
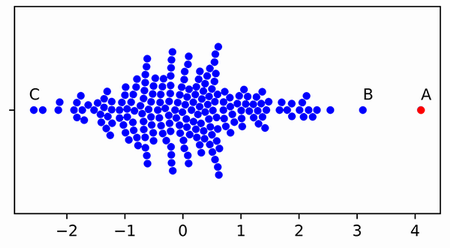
A swarm plot illustrates how an extreme point can change the mean and standard deviation, affecting whether neighboring points are flagged. section 2.1.1
