Swamping occurs when an extreme observation distorts an outlier detector so that an otherwise typical observation is incorrectly flagged. With z-scores, the extreme value shifts the mean and standard deviation, making observations on the opposite side of the mean appear unusually distant. Swamping is the opposite of masking, where extreme observations hide other outliers. section 2.1.1
Points A, B, and C
In a swarm plot, extreme point A can swamp point C: C is classified as an outlier only when A remains in the dataset. Point B illustrates masking because A prevents B from being flagged. section 2.1.1
Use swamping as a warning when evaluating outlier detectors:
- Treat z-score flags cautiously when extreme values influence the mean and standard deviation. section 2.1.1
- Check whether data preparation removes strong outliers before fitting detectors. section 8.5.5
- Test robustness explicitly because clustering-based methods can degrade sharply when extreme training values are added. section 8.5.5
Figure 2.2 A swarm plot with at least one outlier, point A. Depending on the presence of A, points B and C may or may not be flagged as outliers, as A can affect the mean and standard deviation.
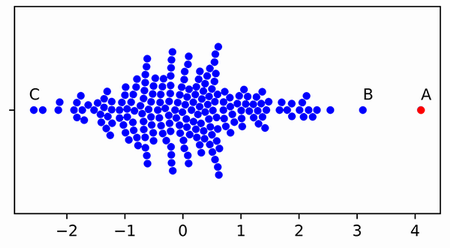
Inspect how the presence of one extreme point changes which neighboring observations receive outlier flags. section 2.1.1
for i in range(10):
  col_name = np.random.choice(df.columns)
  max_val = clean_df[col_name].max()
  clean_df.loc[i, col_name] = max_val * 100.0
Use the extreme-value injection example to test whether a detector remains reliable after contaminated training data is introduced. section 8.5.5
