A memory leak is a software defect in which an application retains objects it no longer needs. Because references remain, the garbage collector cannot reclaim enough memory; usage grows, execution slows, and the application may eventually throw OutOfMemoryError and crash. section 5.1.1 section 5.2.3
Treat steadily increasing heap usage as an investigation signal rather than proof by itself. VisualVM can show continuous growth and intensified garbage-collection activity, while heap dumps are needed to identify the retained references causing the leak. section 5.2.3 section 5.2.2
An intentionally leaking Java application
A Java program repeatedly creates Cat objects and adds them to a static list without removing references. The list grows indefinitely. VisualVM shows used memory rising continuously while GC frees too little; eventually the program fails with OutOfMemoryError. The stack trace identifies the failed allocation, not necessarily the code that retained the objects. section 5.2.3
Investigate a suspected leak with these questions:
- Does heap usage continue rising after repeated garbage-collection cycles? section 5.2.3
- Do GC logs show successive cycles reclaiming less memory, followed by an ineffective full collection? section 11.4.2
- Could the application be under-provisioned instead? A leak retains objects, whereas insufficient memory still allows GC to reclaim memory without a steady usage increase. section 11.4.3
- Which collection, cache, or other reference remains populated, and can a heap dump confirm its retaining path? section 11.4.2 section 5.2.3
Figure 5.10 An OutOfMemoryError is like a ticking bomb. An app fails to remove references to objects it no longer uses. The GC can’t remove these instances from the memory because the app keeps their references. While more objects are created, the memory gets full. At some point, there’s no more space in the heap to allocate other objects, and the app fails with an OutOfMemoryError.
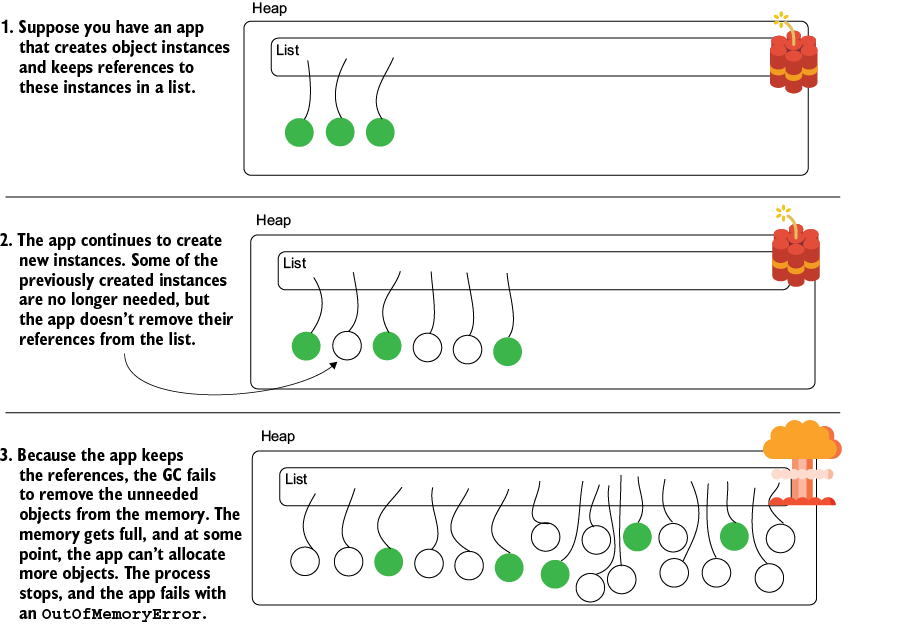
Use the visual model to distinguish healthy memory behavior from a leak: healthy execution returns heap usage after GC, while a leak leaves progressively more data retained. section 5.2.3