A method invocation is one execution-time entry into a method. Counting invocations reveals whether a slow method is costly because it runs slowly, runs too often, or both. section 6.2 section 6.4
Sampling shows total execution time but not call frequency. Profiling, also called instrumentation, intercepts selected code to measure invocation counts and other execution details. Restrict profiling to relevant packages and classes because it consumes substantial resources. section 6.2 section 6.4
Separating latency from repetition
A method that takes 50 milliseconds per execution can consume 50 seconds when invoked 1,000 times. Conversely, a method causing five seconds of latency may be invoked only once, showing that repetition is not always the cause. section 6.2
Figure 6.10 Profiling a part of the app during execution to get details about the times a given method was invoked. We can see that the method causing the 5 seconds of latency is invoked only once, meaning the number of invocations doesn’t cause a problem here.
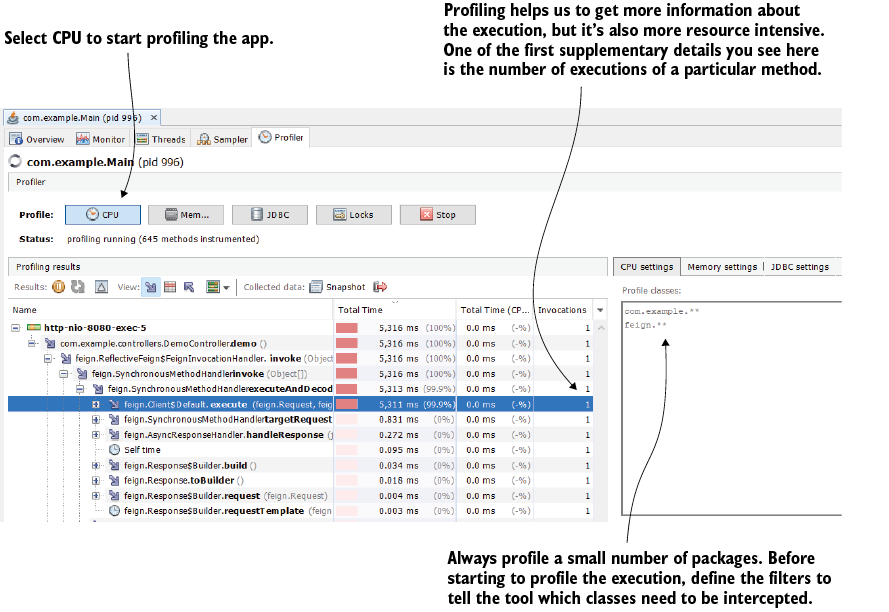
Use the profiling view to compare a method’s latency with its invocation count and determine whether repeated execution contributes to the problem. section 6.2