Metric drift occurs when an evaluation metric’s relationship to the real-world quality or outcome it represents changes over time. A metric can move in a promising direction without reflecting a genuine improvement in user experience. Ongoing retraining makes this a concern even after a model passes an A/B test. section 8.2 section 8.7.2
Feedback loops are one cause. A model influences what users see; their behavior produces logs used for later evaluation and retraining. As exposure narrows, offline ranking metrics such as Precision@K or NDCG may correlate less cleanly with online outcomes. Short-term clicks or dwell time can improve while satisfaction, retention, or diversity declines. section 8.2
A movie recommender feedback loop
Suppose a treatment recommends a narrower set of blockbuster movies than a control. Over time, treatment users build more homogeneous watch histories, while control users retain broader histories. The model has changed user behavior as well as recommendations, complicating both evaluation and comparisons between the groups. section 8.2
Monitor drift as part of the evaluation system:
- Compare rolling aggregates of key online metrics, such as click-through rate and satisfaction, against control baselines over time. section 8.7.2
- Track input distributions separately using population stability index (PSI) or Kullback–Leibler divergence, with alerts for threshold breaches. These diagnose data drift, not metric drift by themselves. section 8.7.2
- Connect live changes to offline diagnostics. If offline metrics predict stability while live metrics drift, investigate whether the evaluation framework remains reliable. section 8.7.2
- Version and monitor any LLM-as-a-judge model and rubric. A judge change can look like product drift even when user experience has not changed. section 8.7.2
Figure 8.5 illustrates a metric drift dashboard mock-up. The left panel shows CTR over time where the stable series fluctuates within normal variance, while the drifting series trends upward beyond the baseline, suggesting feedback-driven distortion. The right panel tracks retention and PSI (Population Stability Index).
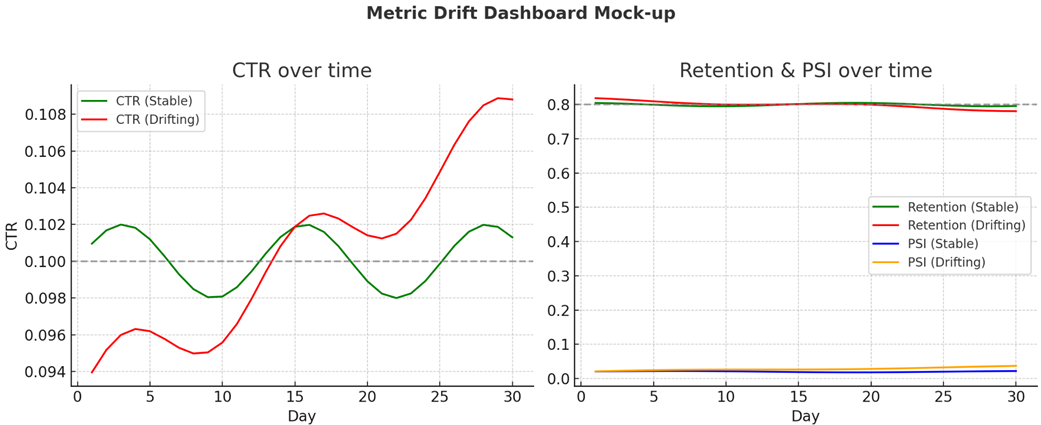
The dashboard pairs click-through rate trends with retention and PSI, helping distinguish metric movement from shifts in the input distribution. section 8.7.2
No single online metric establishes real-world quality. Combine online and offline signals with human evaluation and, where appropriate, LLM-as-a-judge evaluation. section 8.0
