Mood is the prevailing positive or negative emotional tone of a communication. In visual storytelling, it helps determine how viewers feel about the information before they interpret every detail. Colors, shapes, layout, images, and emphasis can all signal a mood and affect how information is perceived and retained. section 8.1
Mood works alongside energy. High-energy emotions such as excitement, anger, and fear convey urgency and activation; low-energy emotions such as contentment, tranquility, and sadness suggest calm or contemplation. Positive mood conveys happiness, joy, and optimism, while negative mood supports more troubling or cautionary interpretations. section 8.1
Figure 8.1 Macro categories for emotion classification
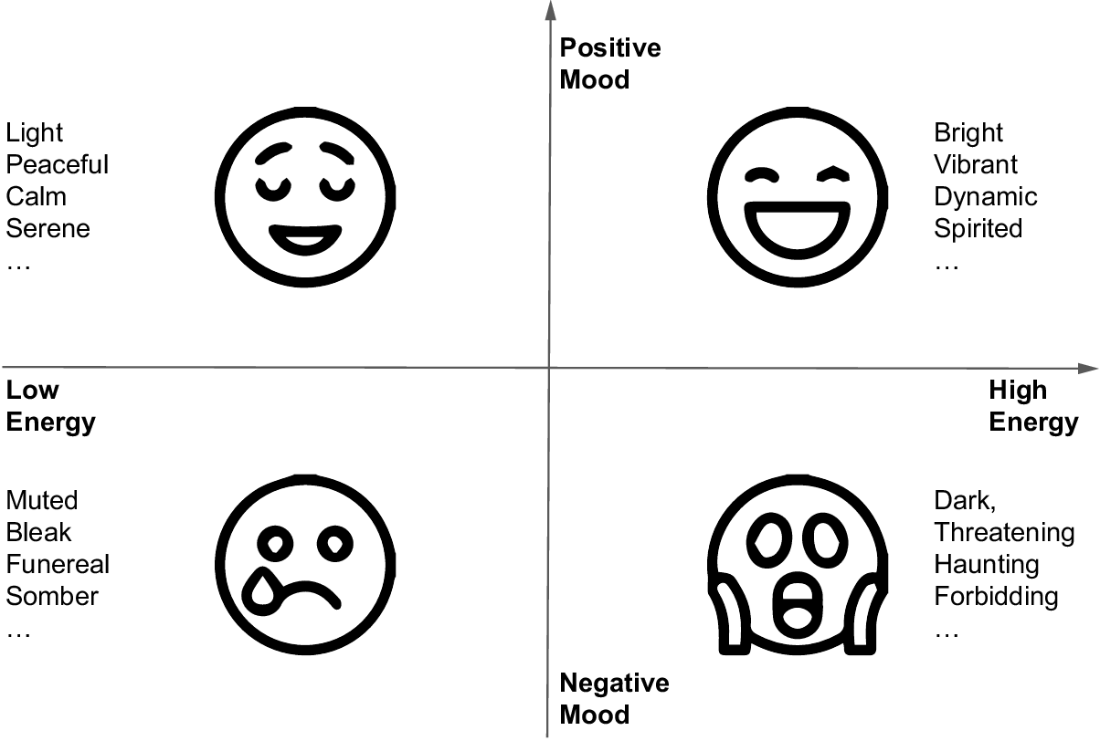
Use the emotion categories to choose a coherent combination of energy and mood before selecting visual cues. section 8.1
Set a deliberate mood by aligning visual choices with the intended message:
- For urgency or alarm, use high-energy, negative cues such as shocking imagery, dark colors, and stronger emphasis on the troubling period. section 8.7.1
- For encouragement and reassurance, use low-energy, positive cues such as relaxing imagery, peaceful colors, and emphasis on an improving trend. section 8.7.2
- Avoid combining conflicting positive and negative cues in one graph when they could confuse the audience or dilute the message. section 8.7.2
Two moods for the same salmon trend
A salmon chart can frame difficult years as a warning: a dead-salmon image, dark red color, and a thicker line for 1992–1998 make the decline feel urgent. The same data can instead support continued action after 1998: a calm aquaculture image, peaceful blue, and a highlighted improving line create a reassuring, positive mood. Choose one framing based on the action the audience should consider. section 8.7.1 section 8.7.2
