A moving range (MR) measures short-term process variability by taking the absolute difference between consecutive observations in an ordered sequence: MRᵢ = |Xᵢ − Xᵢ₋₁|. It is commonly paired with an individuals chart in an I-MR chart. section 14.1.10 section 14.3.4
Interpret moving ranges as a variability signal:
- The average moving range forms the MR-chart center line. section 14.3.4
- MR-chart control limits use constants D4 and D3; the stated D4 value is 3.267 and D3 is 0. section 14.3.4
- Consistent MR values suggest controlled process variability, while large spikes can indicate unusual or special-cause variation requiring investigation. section 14.1.10
Reading an I-MR chart
For individually collected piston-ring diameter measurements, the I-chart shows shifts or trends in the process mean, while the MR-chart shows how variability changes between successive measurements. section 14.3.4
Figure 14.8 An I-MR chart, with the I-chart on top and the MR-chart below. The I-chart plots individual piston ring diameters for each sample, highlighting variation around the process mean. UCL and LCL lines indicate acceptable limits. The MR-chart tracks the moving range, or the difference between successive measurements, reflecting process variability. Lines connect data points from one sample to the next, illustrating changes in measurements and variability across samples.
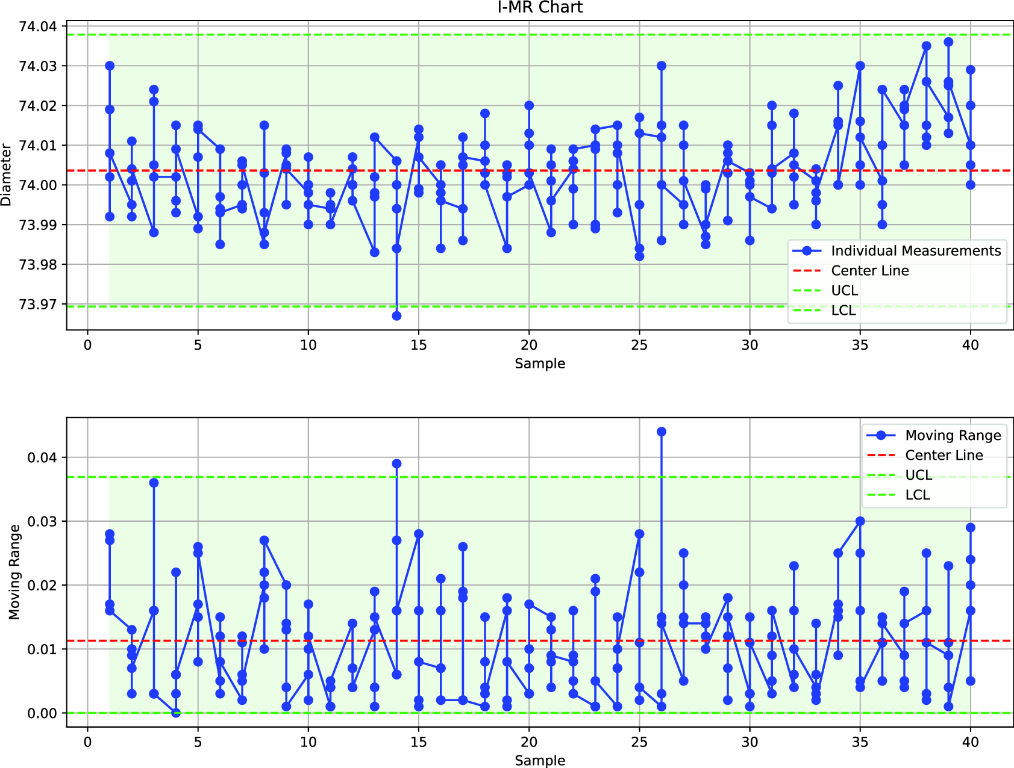
Use the I-MR chart to compare individual measurements with consecutive-measurement variability and their control limits. section 14.3.4
