High-dimensional data represents each observation with many feature dimensions, often dozens, hundreds, or thousands of columns. Outlier detection usually considers all features together rather than inspecting every possible feature subset. section 2.5 section 3.1
More dimensions make unusualness harder to interpret and can weaken algorithms. Distances may become meaningless, detectors may become slow or ineffective, and records can appear anomalous simply because many opportunities exist for unusual values. section 3.1 section 10.1
High-dimensional outlier analysis requires several cautions:
- Treat an observation unusual in one feature as potentially unusual in any higher-dimensional space containing that feature, while recognizing that the effect can weaken when other features look typical. section 2.5
- Expect many observations to lie near the margins of the data space; tests based on abnormality can therefore flag nearly every record. section 3.1.2
- Prefer explanations involving a single feature or a small combination of features, because patterns requiring many features are harder to interpret and less reliable. section 3.1
- Reduce the feature set with dimensionality reduction or train multiple models on feature subspaces to improve efficiency and reliability. section 10.1
Why margins dominate
If 90% of records lie near the center in each dimension, only 0.9^20, about 12%, lie near the center across 20 dimensions; with 40 dimensions, about 1.5% do. Most records consequently appear near a margin. section 3.1.2
Figure 2.16 Two-dimensional scatterplot of data. Some points at the right side of the plot can be considered outliers in the x dimension. Any such outliers will automatically also be outliers in any higher-dimensional space that includes this dimension.
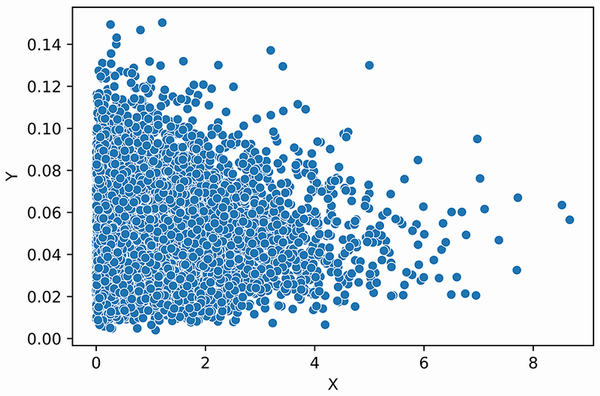
Use the two-dimensional scatterplot to visualize why an observation unusual in one feature can remain unusual in higher-dimensional spaces containing that feature. section 2.5


