An observability service collects and exposes operational data across an AI platform. When a request slows down, it connects signals from model calls, retrieval, guardrails, and tools so teams can locate the bottleneck rather than search isolated service logs. section 7.0
The service provides a unified query interface for logs, metrics, traces, generations, and quality scores. Observability is passive: it records what happened and makes the data available. Experimentation uses that visibility to change behavior and measure the impact. section 7.0 section 7.3
The service contract separates six concerns:
- Logging records events; metrics summarize quantities and trends; distributed tracing follows requests across services. Generations are first-class records of LLM calls. section 7.3 section 7.4
- Scores describe quality; cost management provides financial views; health monitoring reports service health from telemetry patterns. section 7.3
- Traces reference sessions by session_id, enabling conversation-level grouping without duplicating session lifecycle management. section 7.3
Platform services produce telemetry automatically: tracing creates spans and generation records, while metrics publishers attach token counts, latency distributions, and costs. The SDK client buffers and flushes telemetry, so workflow code need not add instrumentation wrappers. section 7.7
Separate stores support different queries: structured events in a log store, counters and histograms in a time-series database, hierarchical traces and generations in a trace store, and linked quality signals in a score store. Dashboards and alerts connect aggregate trends to individual request investigation. section 7.7
Figure 7.1 Observability and experimentation architecture, spanning this chapter and the next. Platform services (left) emit logs, metrics, spans, and generations into the Observability Service (right), which routes them to four specialized stores. The SDK's ObservabilityClient buffers and flushes telemetry from developer workflow code. Dashboards and alerts consume traces, metrics, and scores. The Experimentation Service (bottom, built in the next chapter) evaluates production traces and writes the resulting quality scores back to the Score store.
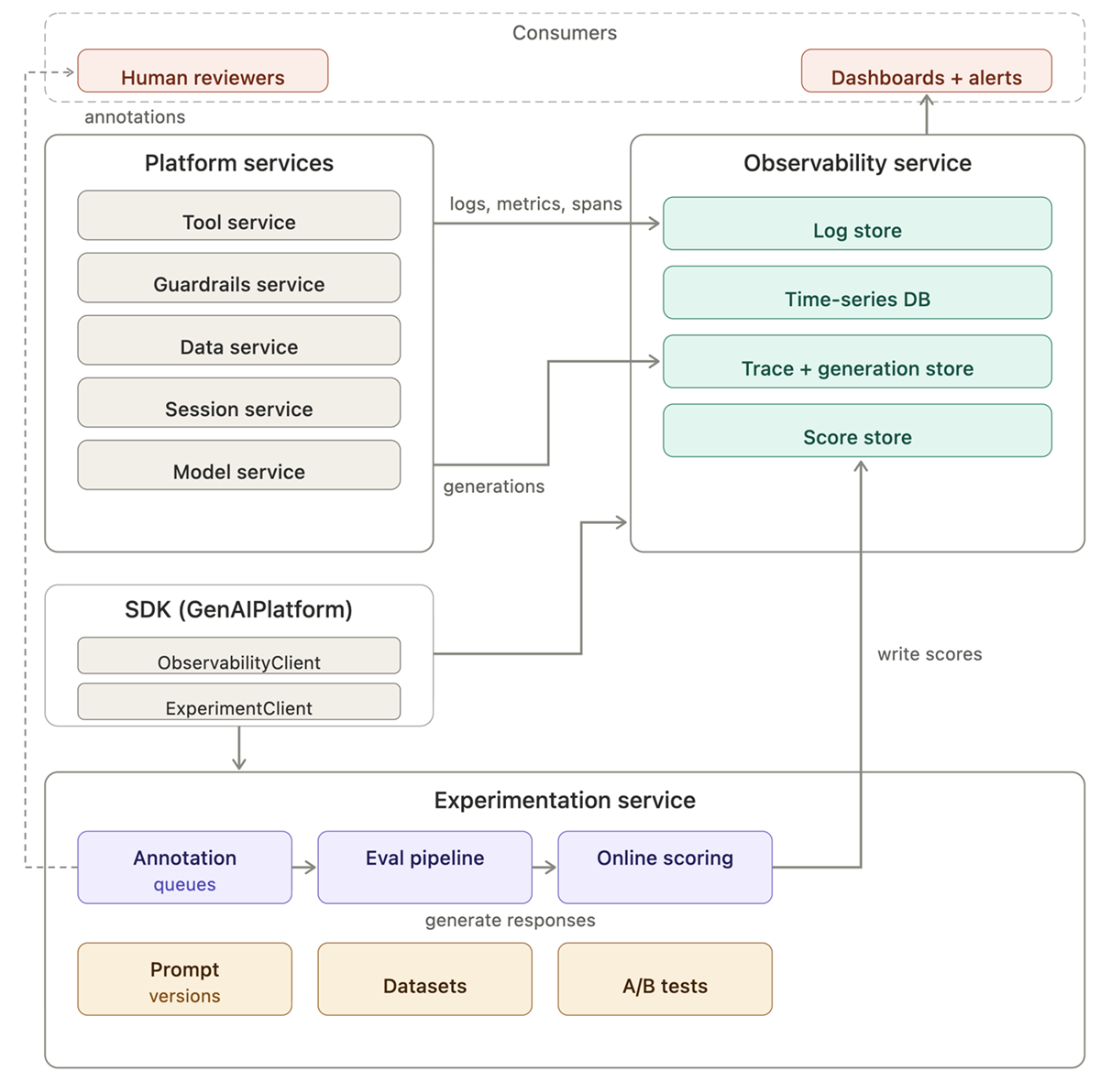
The architecture shows telemetry flowing from platform services and the SDK into specialized stores, dashboards, and experimentation. section 7.0
Drill down on cost
Start with monthly spend grouped by team, filter to the most expensive team and group by workflow, then filter to that workflow and group by model. Generation labels make each drill-down possible. Budget alerts can warn, escalate, and page at configured thresholds, while projections flag likely overruns. section 7.6.2
Find a latency bottleneck
In a 3,240 ms assistant request, two model calls account for 2,430 ms, compared with 185 ms for vector search and 85 ms for guardrails combined. The trace points toward model latency as the larger optimization target; quality scoring is still needed to assess response quality. section 10.10
