An observability system brings telemetry and the means to interpret it into a shared platform service. It helps teams investigate behavior across services rather than stopping at separate views of metrics, logs, and traces. Monitoring and alerting handle expected conditions; tracing, transaction IDs, and flexible analysis help investigate problems that were not anticipated. section 5.2 section 5.5
Access and coverage are part of the product. Integrate with the existing identity provider for single sign-on and role-based access control, so people can use familiar credentials and receive appropriate permissions. Aggregate telemetry across the system: when each team sees only its own services, cross-service incidents are harder to diagnose and recovery takes longer. section 5.2.1
When team-level tooling stops being enough
A small organization can let teams monitor their own services. As the number of teams and systems grows, differing tools leave visibility gaps and make incidents spanning services harder to resolve. A central tooling mandate may standardize tools while still leaving each team to integrate them. A shared observability product becomes more valuable as its users and operational needs broaden. section 5.3
Figure 5.8 Most observability platforms, whether open source software or commercial, will use a similar high-level architecture. Specific technology components will be different depending on scale, but understanding this footprint will be important when considering build versus buy options.
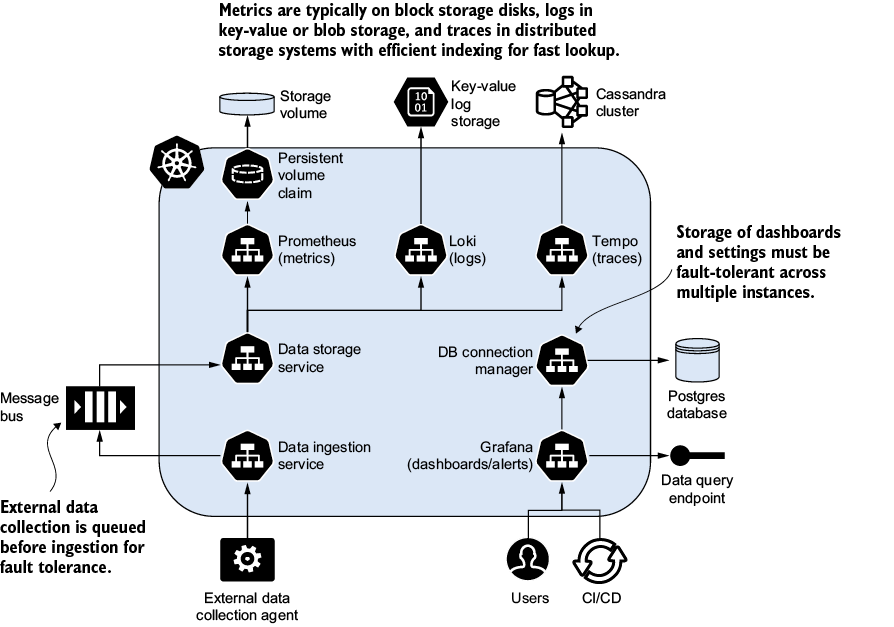
Use the architecture diagram to trace telemetry from collection through buffering, ingestion, storage, and visualization. The component choices can vary with scale and with a build-or-buy decision. section 5.3.1
Build the service incrementally:
- Set observability goals and choose a tool or build a framework with a predictable user experience. Compare cost, time to value, control, support effort, and the opportunity cost of operating tooling—not just licenses and hosting. section 5.5 section 5.3.2
- Instrument code, automate verifiable collection from data sources, and establish shared responsibility. Make deployed workloads observable by default through self-service. section 5.5
- Reduce adoption friction with automated collection, ready-to-use dashboards, training, and support; share incidents where telemetry helped teams resolve a problem. section 5.3.4


