Compare attention, indicated by stars, with actual usage, indicated by downloads. The map helps assess external projects without treating either signal as a verdict: heavier use may reflect a longer history or a fit for more situations. section 4.3.1
The four indicative quadrants distinguish:
- Proven projects, high in both attention and usage. section 4.3.1
- Rising stars, with high attention but thinner usage. section 4.3.1
- Early or niche projects, low on both signals. section 4.3.1
- Invisible infrastructure, with modest social attention but extensive embedded use. section 4.3.1
Different signals, different readings
Preact illustrates high attention and usage; Qwik has attention but thinner usage. Mitosis is an early or niche project, while tslib shows how downloads can reveal infrastructure use that star counts miss. section 4.3.1
Figure 4.3 Plotting interest (stars) against actual usage (downloads).
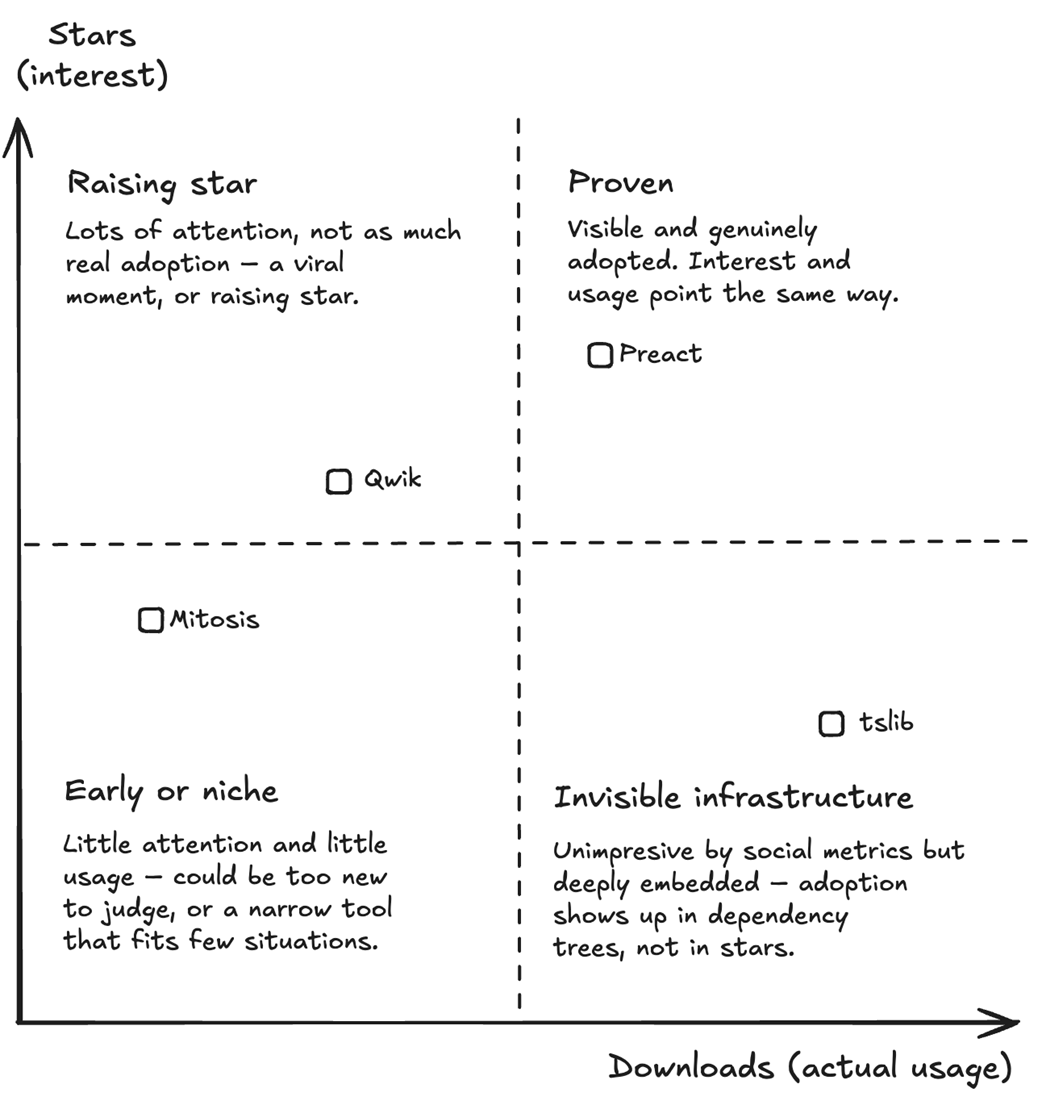
Use the map to compare interest and actual usage; its axes have no universal high-versus-low thresholds. section 4.3.1