The OpenTelemetry Collector is a vendor-neutral service that receives telemetry from gRPC microservices, exposes collector and Prometheus-exporter endpoints, and forwards data to observability backends. section 9.3.2 section 9.3
A production deployment uses the collector to:
- Accept metric requests from gRPC microservices on port 14278. section 9.3.2
- Expose Prometheus-exported time-series data on port 8889 for performance monitoring. section 9.3.2
- Receive traces from services configured with OpenTelemetry SDKs and a Jaeger collector endpoint. section 9.3.4 section 9.3.5
- Preserve request flow across service boundaries through trace and span propagation. section 9.3.5
Deploying the collector with Jaeger
Add the Helm repository, install the Jaeger chart into a jaeger namespace, and verify that Jaeger, OpenTelemetry, and Prometheus pods are running. Configure services to send traces to http://jaeger-otel.jaeger.svc.cluster.local:14278/api/traces. section 9.3.4
Instrumenting a gRPC service
Configure a Jaeger exporter and batched tracer provider, register global trace-context propagation, and attach otelgrpc.UnaryServerInterceptor() to the gRPC server. Add service name and environment metadata for filtering in Jaeger. section 9.3.5
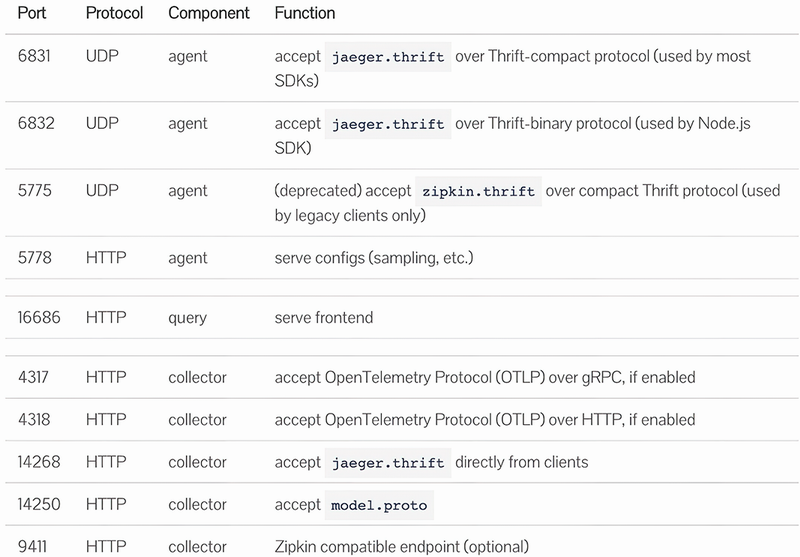
Use the deployment port diagram to relate Jaeger, the collector endpoint, and Prometheus exporter ports. section 9.3.1


