An overparameterized model has far more parameters than needed to fit its training data, so it can interpolate every example. This challenges the classical expectation that increasing model complexity eventually worsens test performance: beyond the interpolation threshold, test error can fall again. section 8.5.2
Near the threshold, a model that barely fits the data may have a brittle solution that is sensitive to noise. Larger models have many interpolating solutions; stochastic gradient descent can find one that fits the training data while generalizing well. Regularization and the optimizer’s implicit biases can also guide this choice. section 8.5.2 section 8.5.3
AlexNet memorizes random labels
A smaller AlexNet reached 99.82% training accuracy on CIFAR-10 with randomized labels, but only 9.86% test accuracy. On ImageNet with random labels, it reached 95.20% top-1 training accuracy. These results show that fitting the training set does not by itself guarantee generalization. section 8.5.2
Figure 8.9 Left: the classical bias–variance tradeoff. Training error (called “risk” in this image) is shown as a dashed line. It falls monotonically, whereas the test error (solid line) is U-shaped, with the bottom being optimal. Right: beyond the interpolation threshold, test error peaks and then declines again in the overparameterized (interpolating) regime, while training risk remains near zero. Used with permission granted by the lead author (Mikhail Belkin).
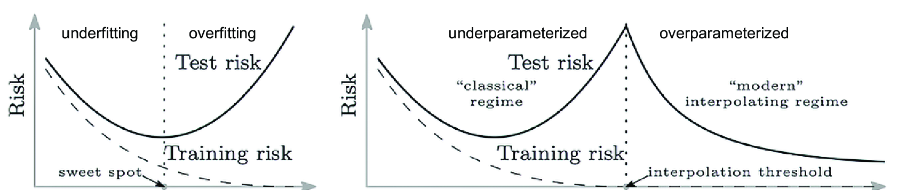
Compare the classical U-shaped test-error curve with the renewed decline beyond the interpolation threshold. section 8.5.2
Figure 8.10 Test (solid line) and training (dashed line) errors for ResNet as the width increases. A peak near the interpolation threshold (dashed line; shaded “critical” band) illustrates double descent, in which error rises as the model fits the data, then falls again for larger widths. Used with permission granted by the lead author (Preetum Nakkiran).
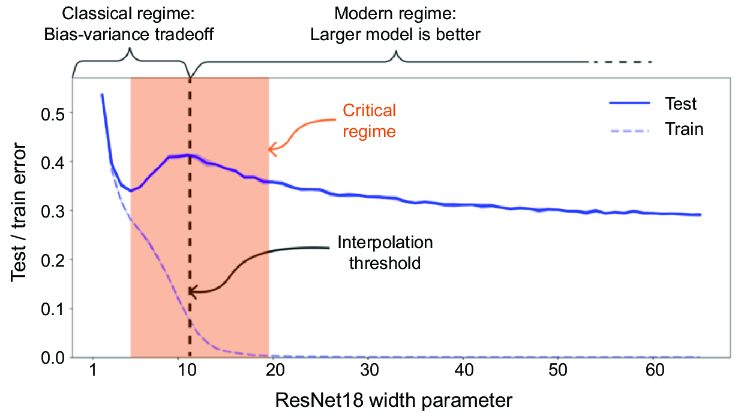
See test error rise near the interpolation threshold and fall again as ResNet width increases. section 8.5.3
