A parametric test makes inferences about population parameters from a sample, using assumptions about the population’s probability distribution. These tests can help analysts assess group differences or relationships, but their conclusions depend on whether the chosen method fits the data. section 4.2.1 section 4.2
Figure 4.19 Parametric statistics assume that the population data follows a specific probability distribution and that you can make inferences about the parameters of that distribution based on your sample data.
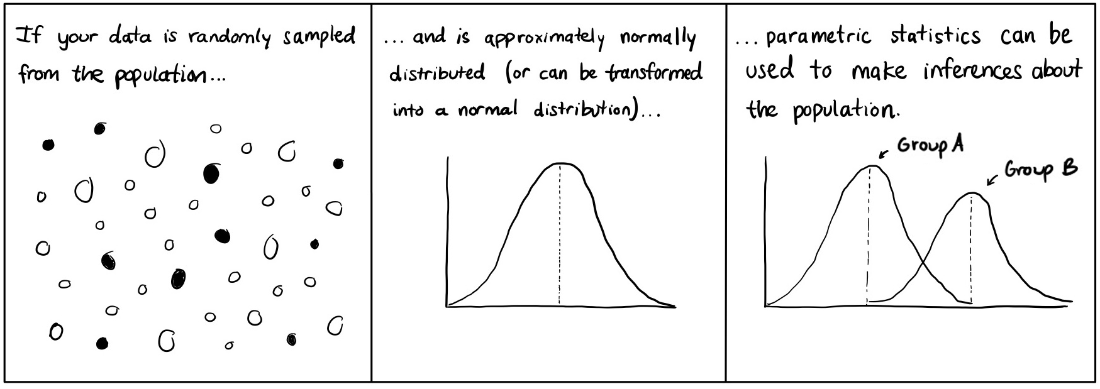
The diagram connects a population distribution and its parameters to inference from a sample. section 4.2.1
Choose a method to match the question:
- Use a t-test to compare two group means, either for independent groups or for paired measurements such as before and after an intervention. section 4.2.1
- Use ANOVA to compare means across two or more groups; it can also accommodate multiple factors. section 4.2.1
- Use Pearson’s correlation to assess the strength and direction of a linear relationship between two continuous variables. section 4.2.1
- Use linear or logistic regression to model relationships between a dependent variable and one or more predictors. section 4.2.1
Check the assumptions of the particular method before interpreting its result. Many parametric tests rely on normal-distribution assumptions, and some group comparisons assume equal variances. Plots can reveal skew, unusual distribution shapes, or extreme outliers that summary measures alone may hide. Pearson’s correlation and linear regression also require a linear relationship. section 4.2.1 section 4.4
When a transformation is not enough
In an app analysis, group distributions are bimodal. Square and square-root transformations do not bring them closer to normality, making a one-way ANOVA an unreliable choice under its assumptions. A non-parametric alternative may be more suitable, but it should be selected for the question and data rather than simply assumed to have no requirements. section 5.1 section 5.0
A p-value is commonly used to judge statistical significance: for a group comparison, it describes how surprising a difference at least as large as the observed one would be if there were no population difference. Sample size affects significance, so explain the size and practical relevance of a difference as well as its statistical result. Communicate assumptions and limitations clearly to stakeholders. section 4.4 section 4.2.1
