Parca is an open-source continuous profiling platform that collects and analyzes running-software profiles without application instrumentation. It uses eBPF for zero-instrumentation collection and Prometheus service discovery to find profile sources. section 9.1.3
Parca’s practical profile workflow includes:
- Collect profiles from supported languages including C, C++, Rust, Haskell, Java, Python, .NET, and WebAssembly. section 9.1.3
- Scrape a profile-producing endpoint using a Parca configuration and inspect selected profiles as line graphs or Icicle Graphs. section 9.1.5
Profiling an OpenTelemetry Collector
A Docker Compose setup enables the Collector’s pprof extension, runs Parca on port 7070, and configures a two-second scrape interval. After profiles accumulate, selecting Memory In-Use Bytes and opening the line graph reveals an Icicle Graph for troubleshooting resource usage. section 9.1.5
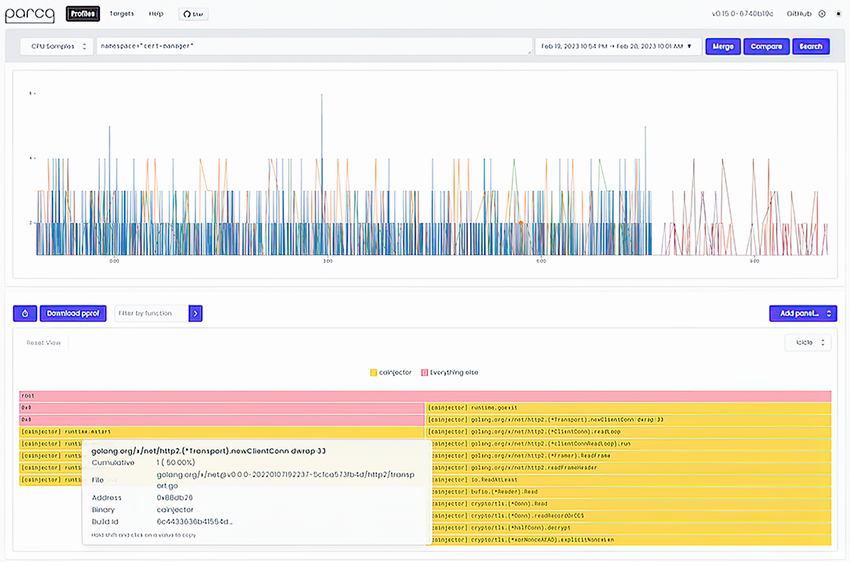
Use the Parca demo screenshot to orient yourself to its profile-analysis interface. section 9.1.3
